

Hedging Mideast “Crash Out” Risk– Update 5: EIS/KSA Barbell Optionality Strategy for MSCI ACWI ex-USA Allocation
1. Hedging MSCI ACWI-exUSA Exposure with KSA/EIS Optionality— Bottom Line Up Front:
Chief Investment Officer at BlackRock, Ms. Wei Li, who has a Maths degree from Cambridge, was on Bloomberg Surveillance last week highlighting BlackRock’s shift to “neutral weight” global equities; noting the asymmetry of upside vs downside skew given US Stocks were still only 4% off their highs. Ms. Li recommended directionally (delta) neutral strategies given the headline risk of binary outcomes for the USA-IRGC war.
On Monday pre-market 2 March 2026, DuLac Capital Advisory L.L.C. projected that Institutional Investors would likely engage in a Delta Neutral EIS/KSA ETF (or other index products such as broker index Total Return Swaps) Strategy to gain optionality in the event of an underpriced Mideast “Crash Out” scenario.
Five key findings since the publishing:
Creation Activity Up: EIS ETF and KSA ETF have both experienced net creations in shares (more below).
UAE ETF Short Interest Up but lower than 2019: UAE ETF, the worst performing Mideast exposure, has seen a rise in Short Interest (SI), but it’s still lower than the 2019 SI recorded during the blockade they and Kingdom of Saudi Arabia (KSA) ran against Qatar in 2019.
Beta Adjusted EIS/KSA Barbell Beats MSCI ACWI-USA Month to Date (mtd): A beta factored barbell strategy with EIS and KSA ETFs has outperformed MSCI ACWI-USA by a substantial margin.
Rising Beta Dispersion in EIS Due to Healthcare: The underlying health care constituents in EIS ETF such as TEVA have caused a massive left tail beta shock; thus causing institutional investors to have to restructure their options overlay strategy and net exposure relative to KSA ETF.
Bull Strangles Overlay Strategies with KSA– Protective Strategies with EIS: This indicates investors may be using KSA ETF for their positive oil beta exposure while also engaging in moderately bullish options overlay strategies such as Bull Strangles. Meanwhile, it seems that institutional investors are medium term optimistic on MSCI Israel IMI, but hedging near term supply chain disruption with short exposure via liquid underlying constituents such as TEVA.
DuLac Capital Advisory L.L.C. projects as the market now approaches the “top of the second inning” with the war, that Institutional Investors (pension funds, structurally long asset managers, long only mutual funds, and endowments) will likely hedge their KSA/EIS barbell optionality strategy with a bearish credit put structure on MSCI ACWI-exUSA index products such as iShares MSCI ACWI-exUSA ETF (ACWX), iShares MSCI East Asia EM ETF (EEMA), and Vanguard FTSE All-World ex-US ETF (VEU: FTSE All-World ex US Index).
KSA Has Outperformed MSCI ACWI-exUSA (ACWX ETF) on Absolute and Risk-Adjusted Basis MTD— Delivering a Net of 15% Applying a long/short Strategy vs ACWX ETF:
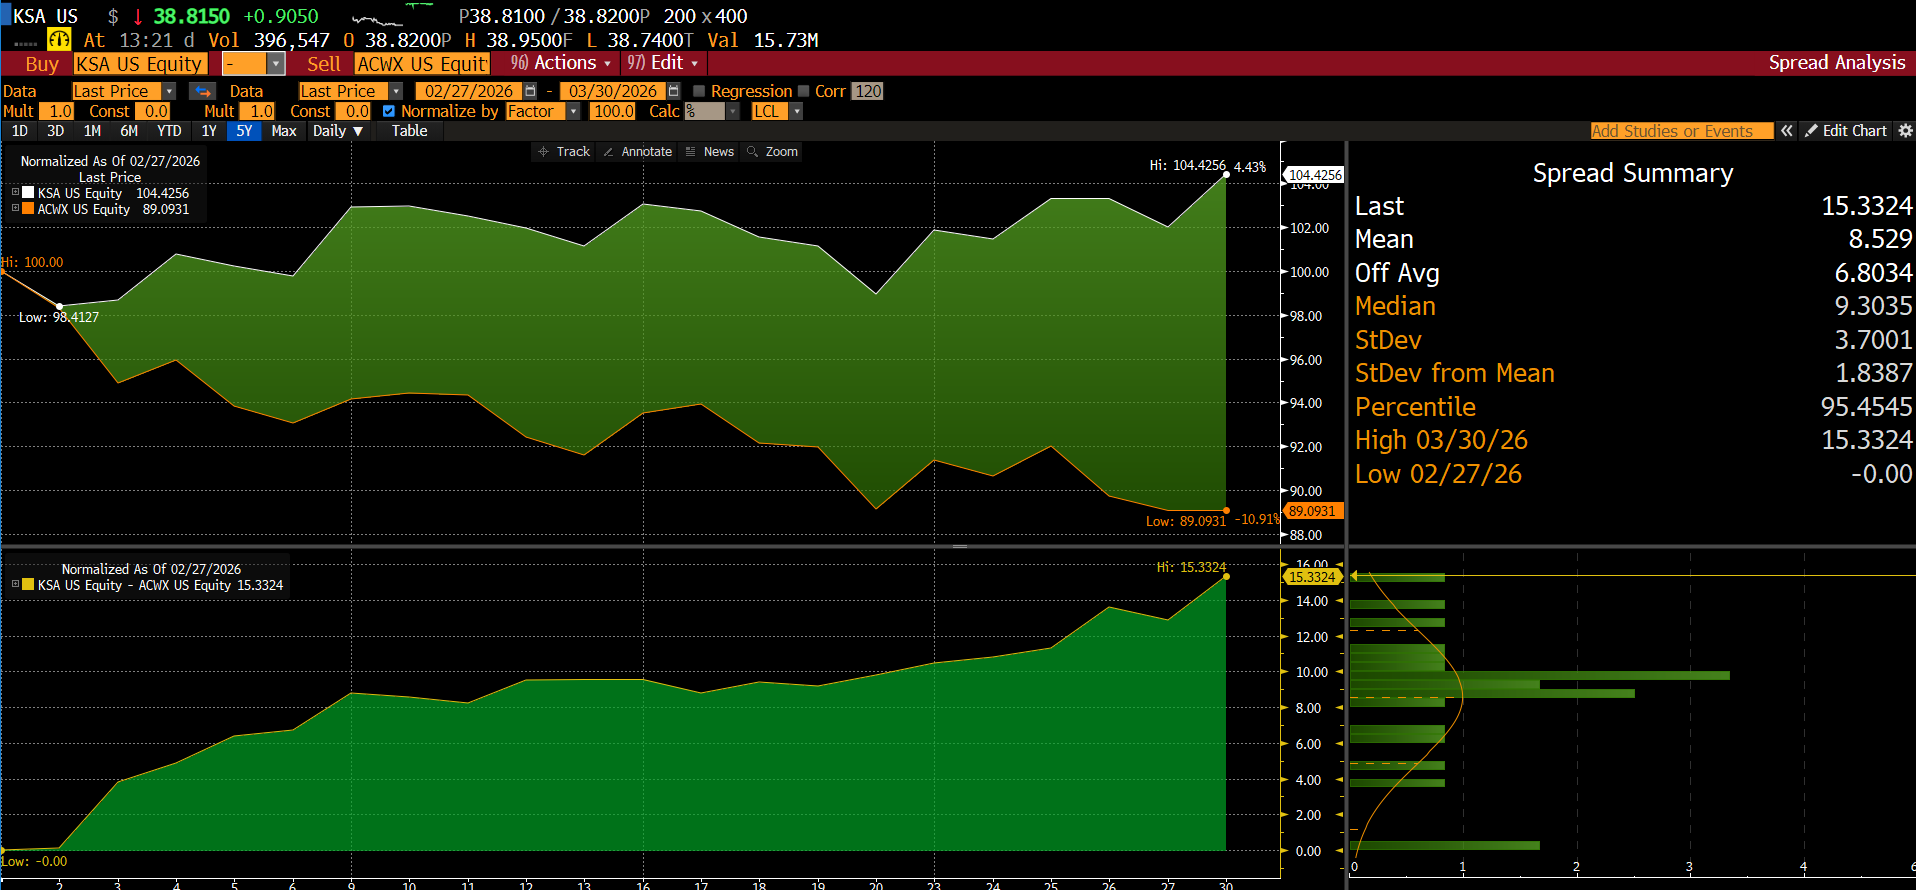
KSA ETF, EIS ETF, EEMA ETF, SPX 500 Index vs ACWX Total Return NAV basis. Source: Bloomberg Terminal as of 3/27/2026
2. Market Context: Rounding Error but Not Insignificant at the Margins
During the third week of March, there was a lot of financial news and X posts about the alleged well-timed $1.5Bn long on S&P 500 Index futures just before Monday’s (23 March 2026) Truth Social Post from POTUS that reversed the day’s gains in Brent, and stopped the losses in global equities. Goldman Sachs noted there was massive short covering at the end of the market, with much of that driven by the most liquid macro products such as ETFs and broker-dealer Total Return Swaps on indices.
ETF Perspective on S&P 500 Index: In perspective the three largest S&P 500 Tracking ETFs (SPY from State Street, IVV from iShares, and VOO from Vanguard) combined to close to $2 Trillion. The $1.5B bet on the S&P near its session lows that morning could have just been an Authorized Participant hedging a redemption/creation request from an institutional holder of one of the three largest S&P 500 ETFs.
Prices Set at the Margins: Nonetheless, during times when the uncertainty of the volatility of volatility is increasing, these “drops in the bucket” trades end up being the forest among the trees in terms of high signal, low noise market trends. Prices are set at the margin and thus it’s time to do a forensics oa few regional ETF creation/redemption mechanics, short interest signals, and index tracking.
Signals with ETF Creation/Redemption and Short Interest: One such signal of late for MSCI ACWI-ExUSA benchmarked tied pension funds, endowments, foundations and structurally long-only asset managers should be aware of is the uptick in Short Interest on key constituents of ACWX.
Hedging Tail Risk via ACWX Optionality Amid Looming Ground Invasion: This is critical since the WSJ reported this morning (30 March 2026), that the Pentagon is considering sending Special Operators such as Marine Force Recon and Navy SEALs DEVGROUP to Iran to secure control of loose Uranium.
3. Deciphering Creation/Redemption Signals vs. Realized Volatility
Examining creation/redemption signals juxtaposed to ETF volatility is telling– for instance, for iShares MSCI Kingdom of Saudi Arabia ETF: KSA, redemption of outstanding shares has been muted up to March 10, 2026– despite a near 40% rise in realized 20D volatility. Since then, creations increased despite a jump in trailing 20D Annualized Volatility vs KSA ETF’s historical 10 year average. This implies strategic allocators are positioning to upweight their pro-commodity shock sensitive exposure with KSA allocations: especially given the Kingdom of Saudi Arabia’s Yanbu Pipeline (as mentioned as a catalyst for the positive asymmetry for MSCI KSA Index exposure vs. MSCI ACWX Index in our 2 March 2026 note.
Realized Vol (20D Annualized) Has Declined for KSA ETF vs Initial Jump Earlier in March 2026—Creations Have Gained Momentum for KSA ETF—
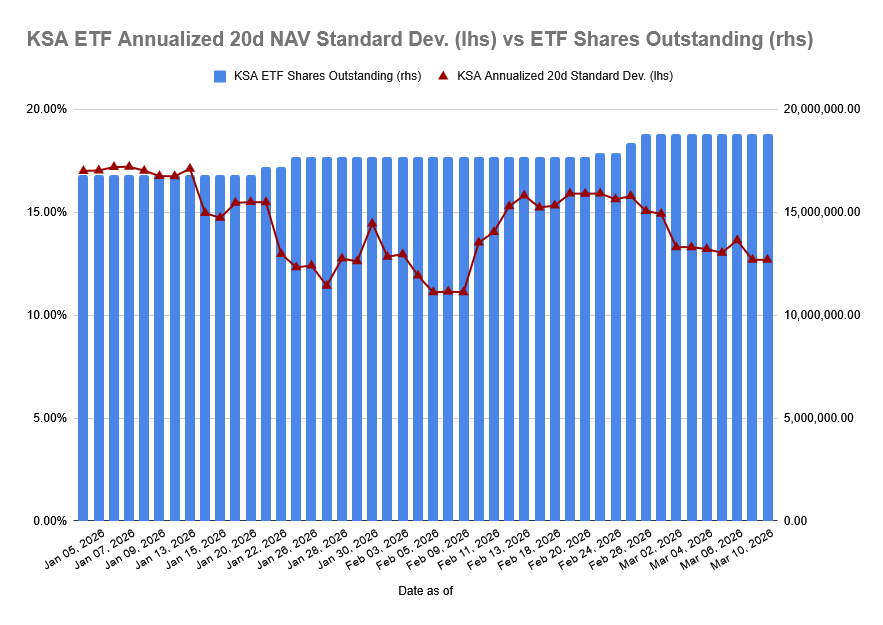
Source for KSA ETF Creation/Redemptions and Annualized 20Day Volatility: iShares.com and Google Finance as o 3/27/2026
As projected on 2 March 2026 by DuLac Capital Advisory L.L.C., institutional investors have indeed used KSA ETF as a macro product to gain positive gamma and vega risk optionality perceived as beneficial for energy heavweight MSCI Saudi Arabia IMI exposure. Could this Indicates Similar Allocations Upweights for Institutional Pension/Endowments via Separately Managed Accounts into Quarter End?
If MSCI Saudi Arabia is approximately 1% of the $3 Trillion tied to MSCI ACWI-exUSA Index that implies $30B in dedicated assets to Saudi Arabia equities (albeit some pension funds and endowments may have Investment Policies that prevent them from allocating to the Kingdom of Saudi Arabia, similar to what we’ve seen with the PRC over the last five years). A mere 25% increase in allocation dedicated to KSA, would generate an additioanl $7.5B in index based capital: the KSA ETF will likely serve as an interim beta instrument as large managers re-pivot their global equity portolios’ “aircraft carriers” over the next quarter.
KSA ETF Portolio Risk Factor Contribution is Driven by the Tailwinds of Valuation, Growth, Beta/Volatility Minimization, and Earnings Yield— These Factors have been Rewarded by the Market since the War’s Inception
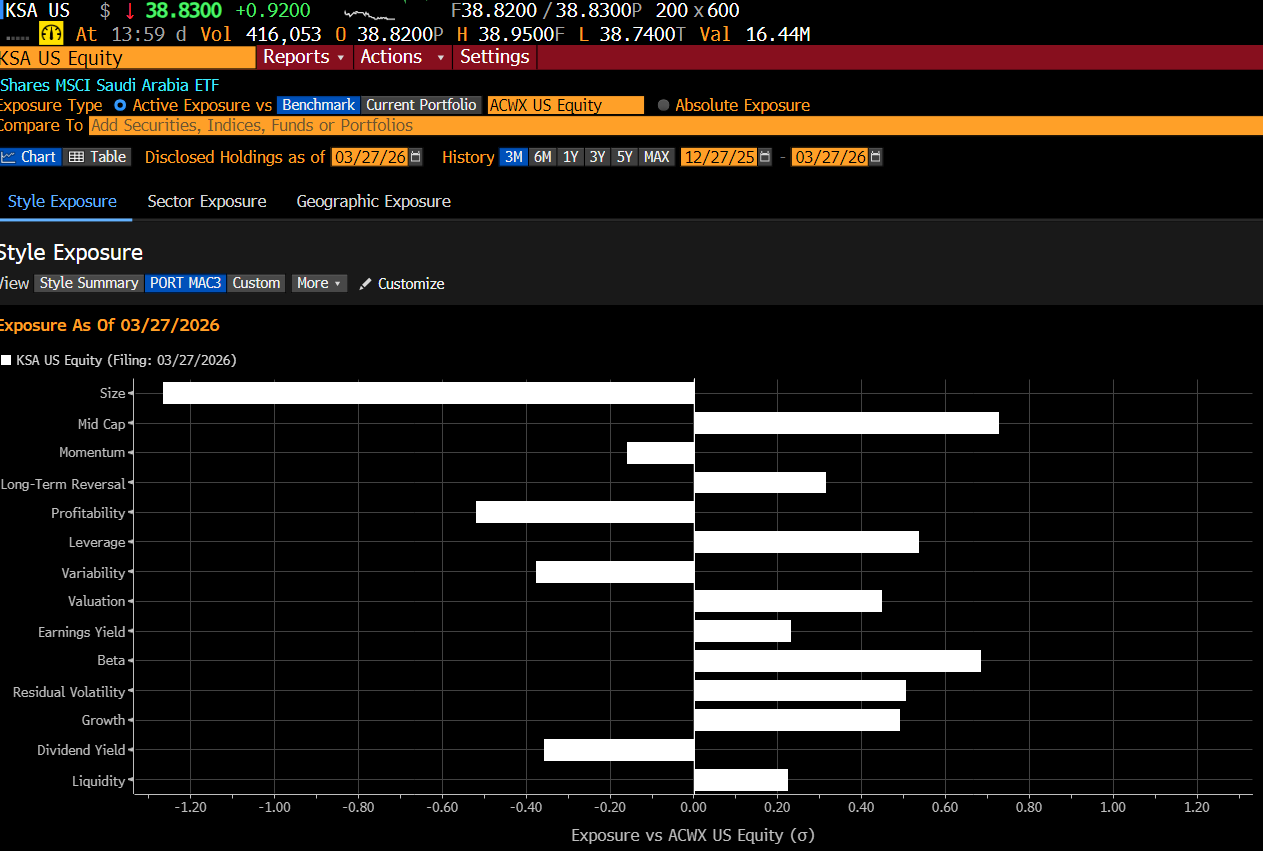
KSA ETF Portfolio Risk Factor Contribution Report, Source: Bloomberg Terminal as of 03/27/2026
MSCI KSA Top Decile Performance in MSCI ACWI ex-USA MTD (03/30/2026): Driven by Materials, Banks, Energy
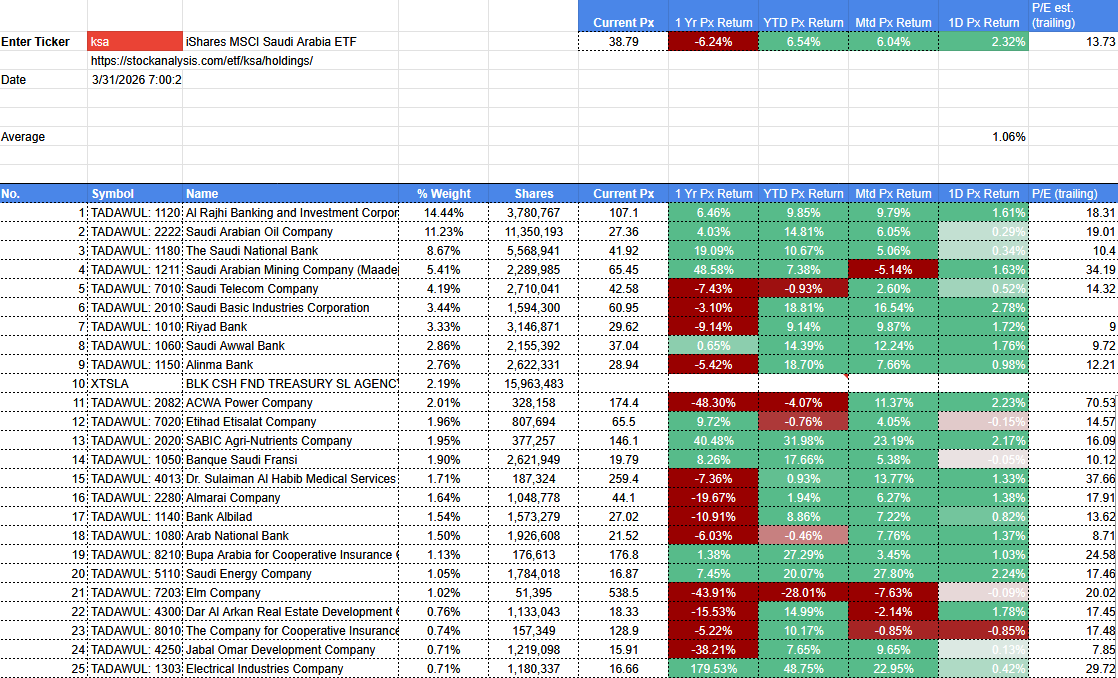
KSA ETF Underlying Constituents & Price Performance: Stockanalysis.com, Google Finance as of 3/30/2026
Comparatively, EIS ETF Portfolio Risk Factor Contribution: Headwinds Derived from Its Leverage and Beta Risk Factor Exposure Relative to ACWX
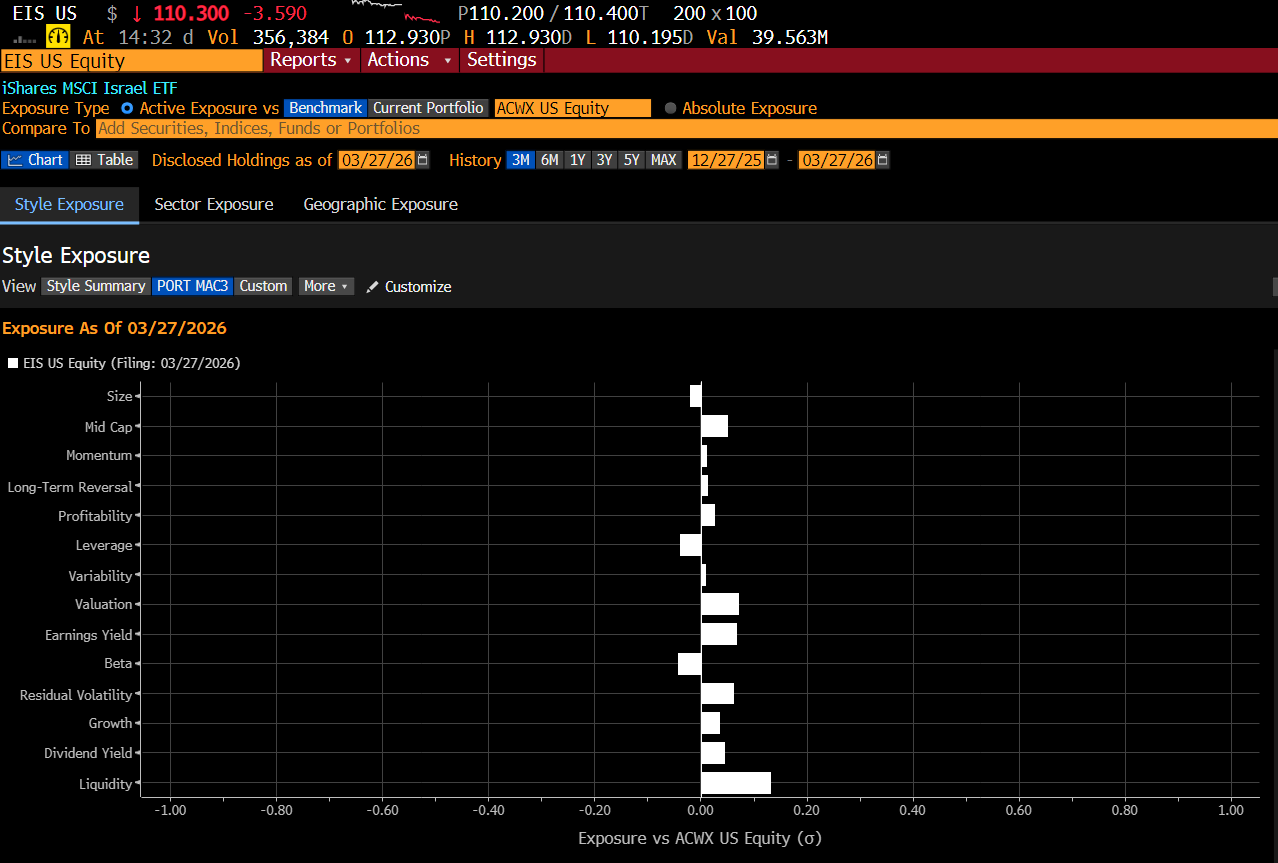
EIS ETF Portfolio Risk Factor Contribution Report, Source: Bloomberg Terminal as of 03/27/2026
MSCI Israel Beta Dispersion vs MSCI Saudi Arabia: For EIS ETF— Healthcare and Finance Act as Negative Contributors to Performance MTD (03/30/2026)
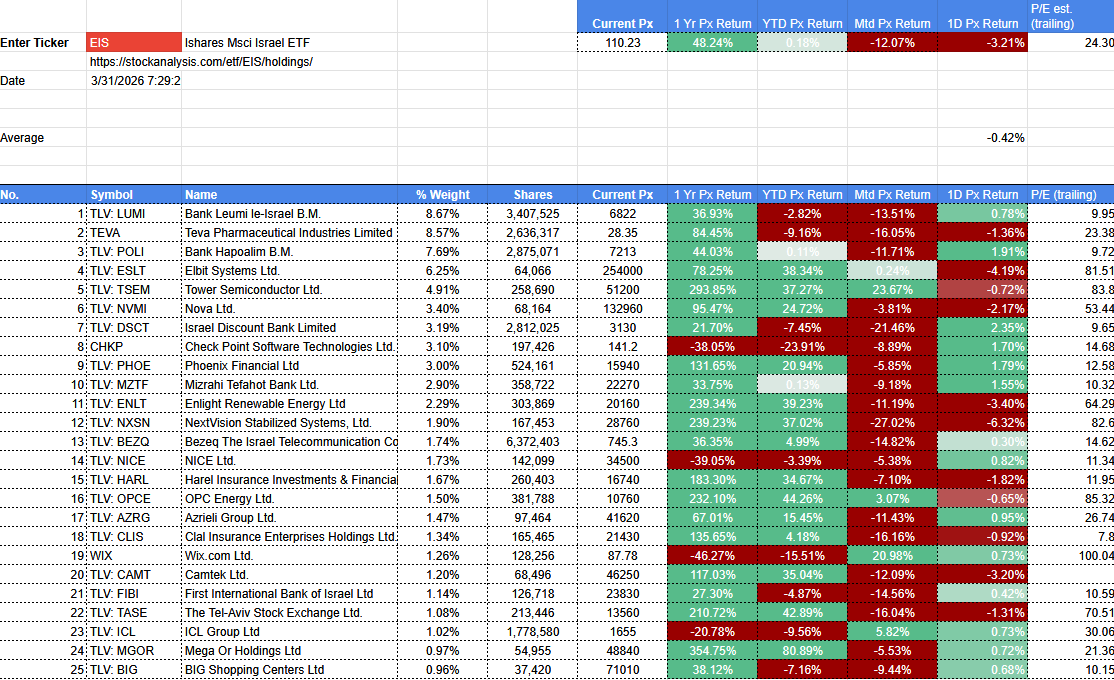
EIS ETF Underlying Constituents & Price Performance: Stockanalysis.com, Google Finance as of 3/30/2026
Despite the Jump in Realized Volatility and Underlying Constituents (such as TEVA) Beta to SPX 500, Net Creations Have Increased for EIS ETF Since the Start of the War:
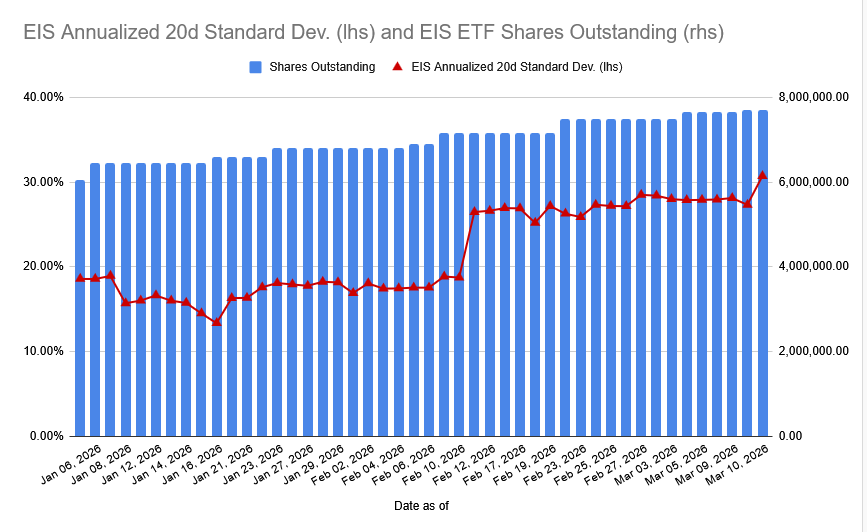
Source for EIS ETF Creation/Redemptions and Annualized 20Day Volatility: iShares.com and Google Finance as o 3/27/2026
EIS ETF Realized Vol is Approaching Levels Last Seen During June 2025 USA MOAB Bombing of IRGC Nuclear Reactor Sites
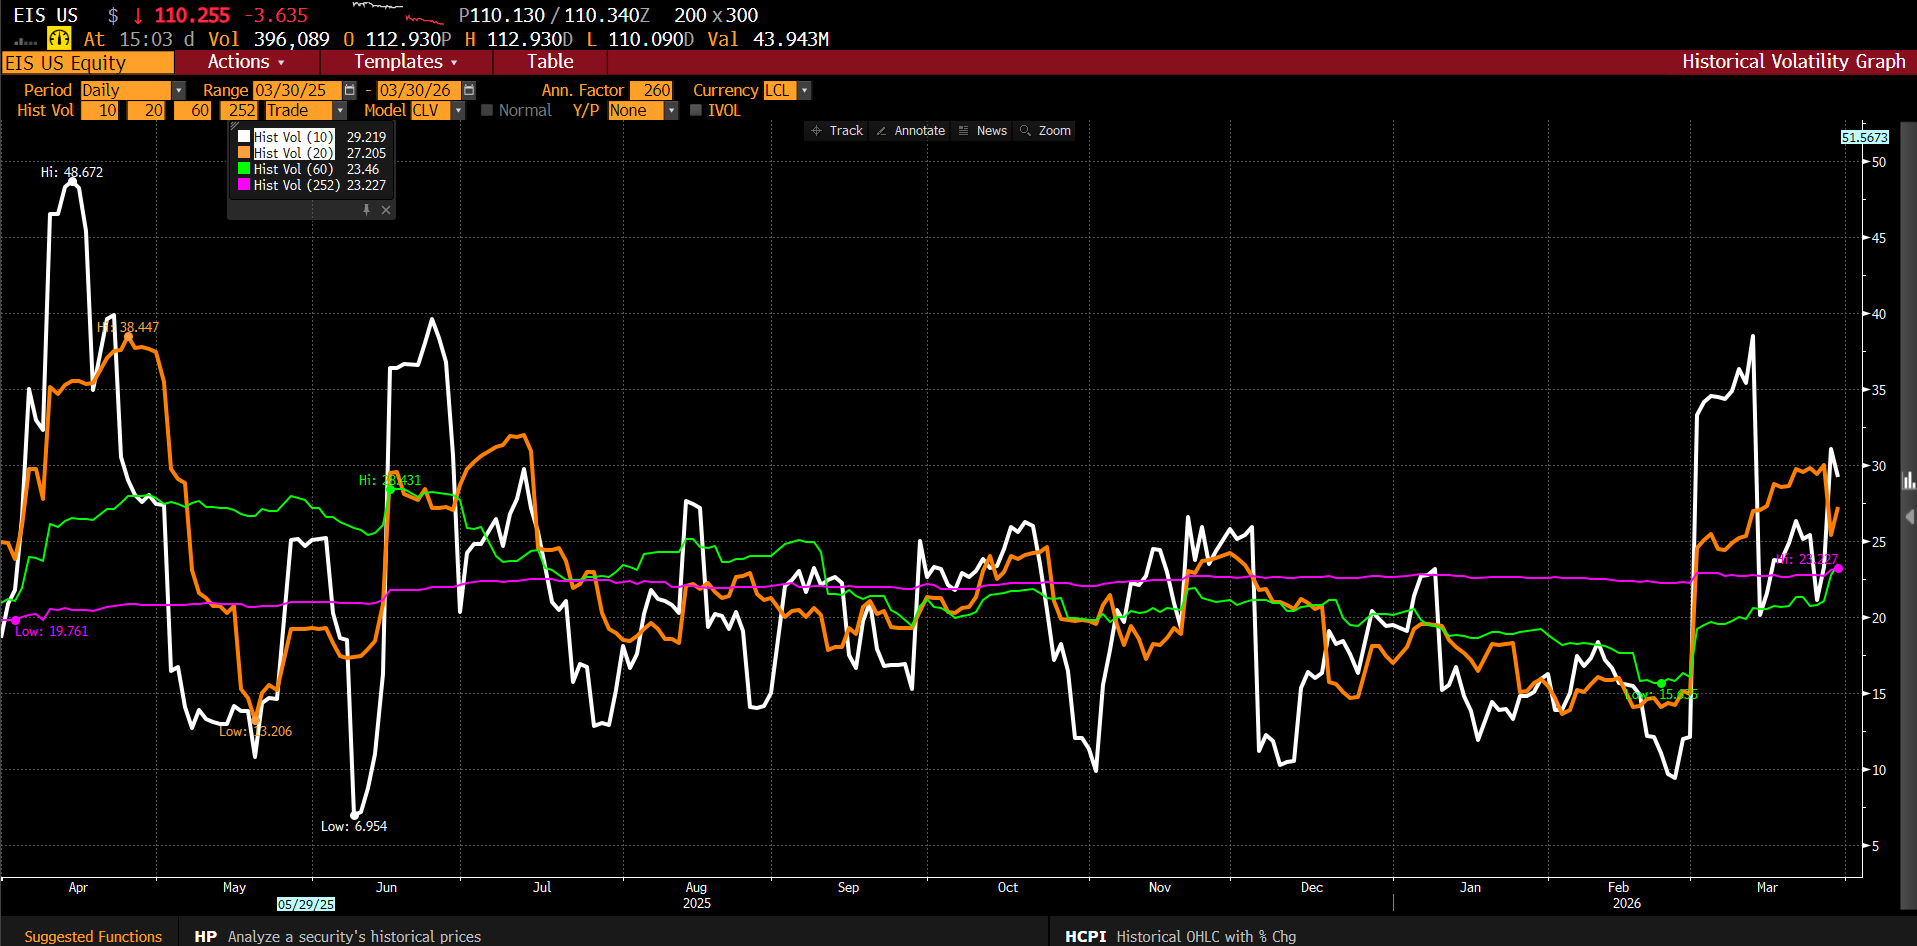
Source of Annualized Realized Volatility Chart: Bloomberg Terminal as of 3/30/2026
EIS ETF and KSA ETF Have Recorded some of the Strongest Fund Flows for Single Country Focused ETFs in March 2026— Ranking in the Top 10 Despite Being in the Middle of a War Zone
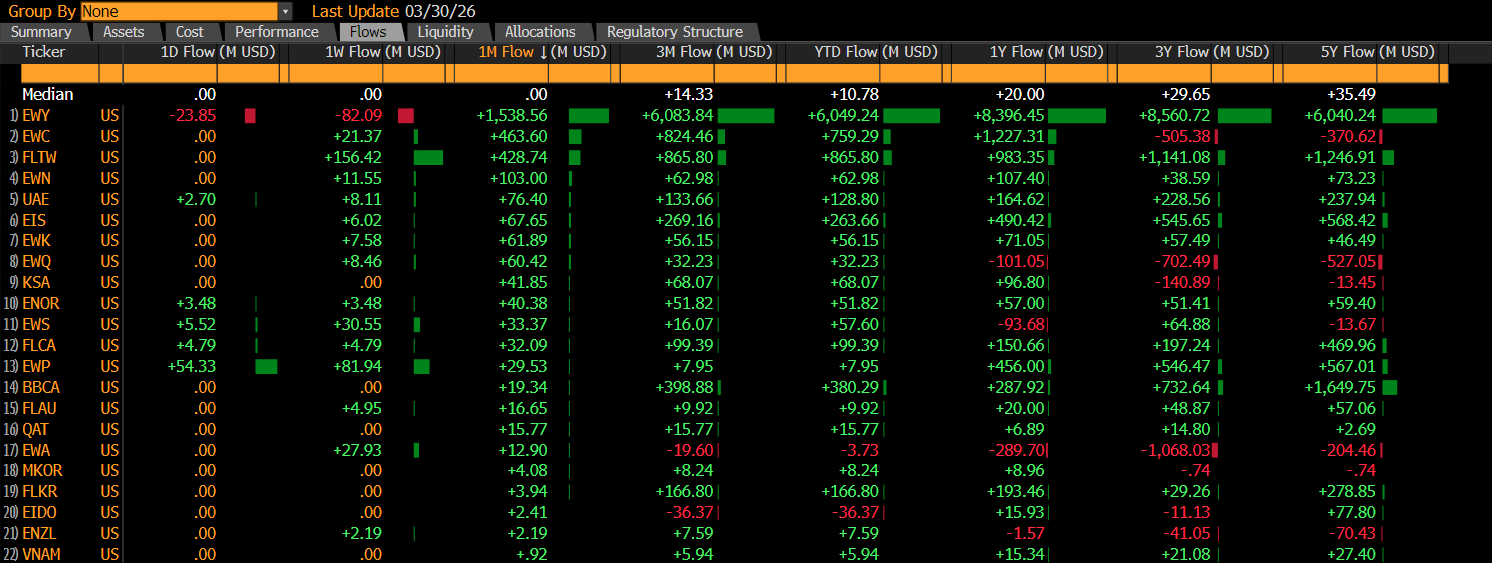
Single Country ETF Net Fund Flows Courtesy of Bloomberg Terminal as of 3/30/2026
The combination of net creations for both KSA ETF and EIS ETF in spite of an uptick in aggregate realized vol for ACWX indicates institutional investors are using the two funds as proxies to balance the twin investment themes of commodity price shocks and tech infrastructure resilience. MSCI Israel though has undeperformed ACWI ex-USA in the second half of March 2026, likely driven by fears that as reported by the Wall Street Journal, that the State is having to ration interceptor missiles associated with its Iron Dome shield.
4. Institutional Investors are Hedging their GCC Exposure through Shorts via UAE ETF— Which has experienced a 6+ Sigma Volume Jump in March 2026
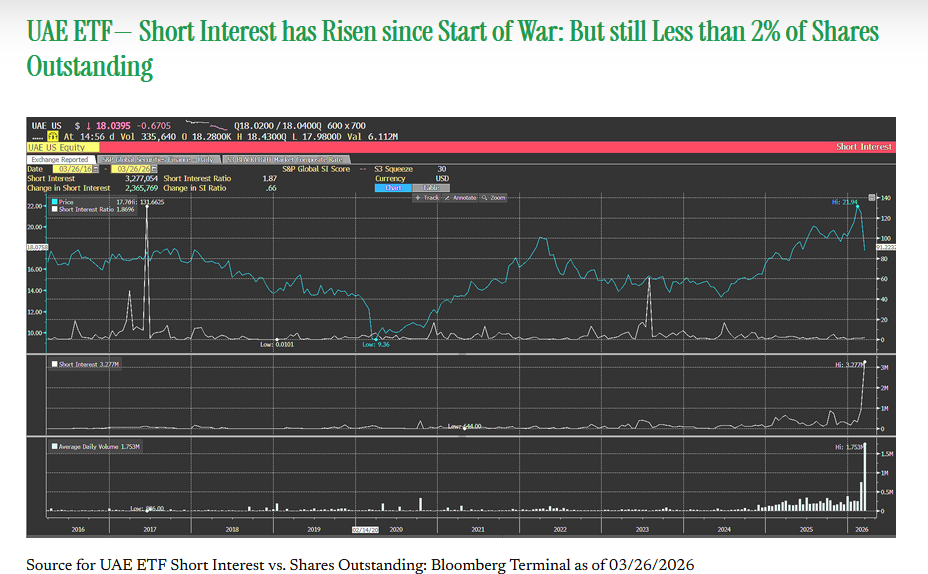
Institutional Investors have hedged the risk of systemic civilian and industriial infrastructure damage to the GCC primarily through UAE ETF: a massive spike in trading volume has been recorded in March 2026 vs long term norm (bottom most bar chart), which corresponds with an uptick in Short Interestt. Nonetheless, as a percent of shares outstanding, UAE ETF SI is still relatively low compared to the 2017 period during a previous GCC geopolitical risk shock.
Net net, this speaks to the growing institutional use case for single country ETFs providing macro hedging exposure during periods of beta dispersion and closed underlying markets. Price discovery and secondary market liquidity has long been a key beneffit of ETFs as an institutional tool alongside other index products such as TRS, custom dealer baskets, and Futures contracts.
5. Three key factors are Driving the Rise in the Uncertainty of Volatility of Volatility Across Asset Classes:
Increase in term premium of the U.S. Treasury Rate curve as the bond vigilantes are now annualizing the $5 Billion costs for the first two weeks of the war.
Muscle Memory: seasoned investors remember the drawdown in SPX-ex Energy during the first two months of Operation Iraqi Freedom under President Bush in 2003: much of that driven by fears of President Saddam engaging in another regional energy infrastructure terror campaign as he did in 1991.
The IRGC maritime guerilla war strategy at the Strait of Hormuz that has blocked off 30% of global seaborne oil is now causing institutional investors to calculate a global cost input tax on ACWX exposure– particularly hitting commodity importing East Asia and Europe hard.
Looking Under the Hood of MSCI ACWI-Ex USA index: a benchmark for $3 Trillion in AUM per MSCI
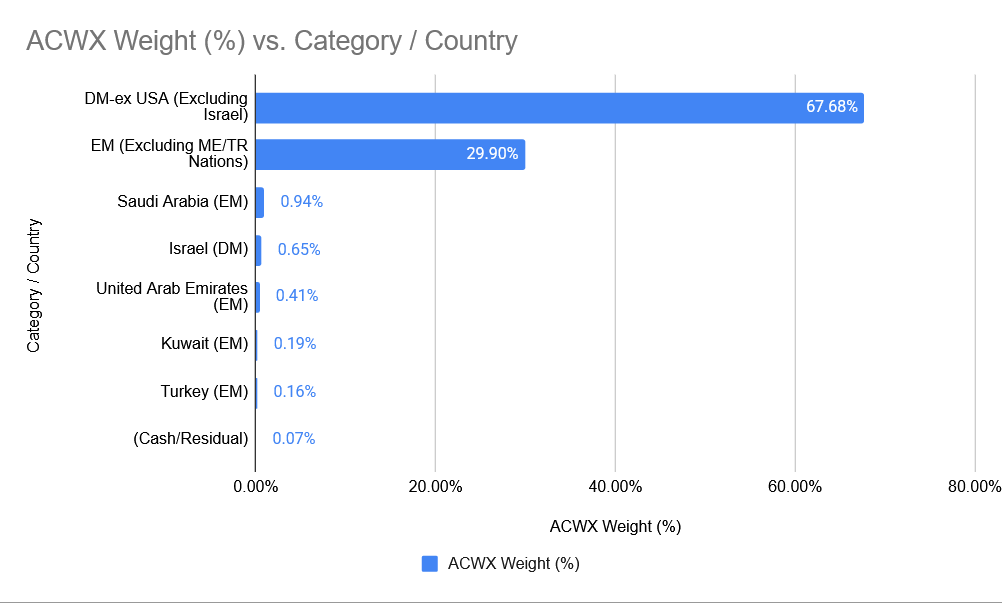
Source for ACWX ETF Geographic Exposure: iShares.com and Google Gemini as of 3/27/2026
Mideast countries— KSA, UAE, Israel, Turkey, and Kuwait combined to over 2.35% of market value for MSCI ACWI ex-USA Index proxy, iShares MSCI ACWI ex-USA ETF (ACWX) as of 3/27/2026. Their beta profiles are too significant to ignore for Institutional Investors hedging their global allocation through shorts on liquid KOSPI Futures or underlying constituents of MSCI Taiwain/MSCI China for example.
Looking under the hood of MSCI ACWI-USA is revealing: there’s been noticeable dispersion of betas within companies and amongst regions due to the volatility regime shift across asset classes. Recall Brent Oil has experienced a 4+ sigma move this month: yet bonds and stocks have only recently entered into correction territory despite largely being negative beta to Brent Crude on a global basis, historically.
ACWX ETF Beta to SPY ETF is at Highest Level since 3Q 2018— The Tariff Tantrum—
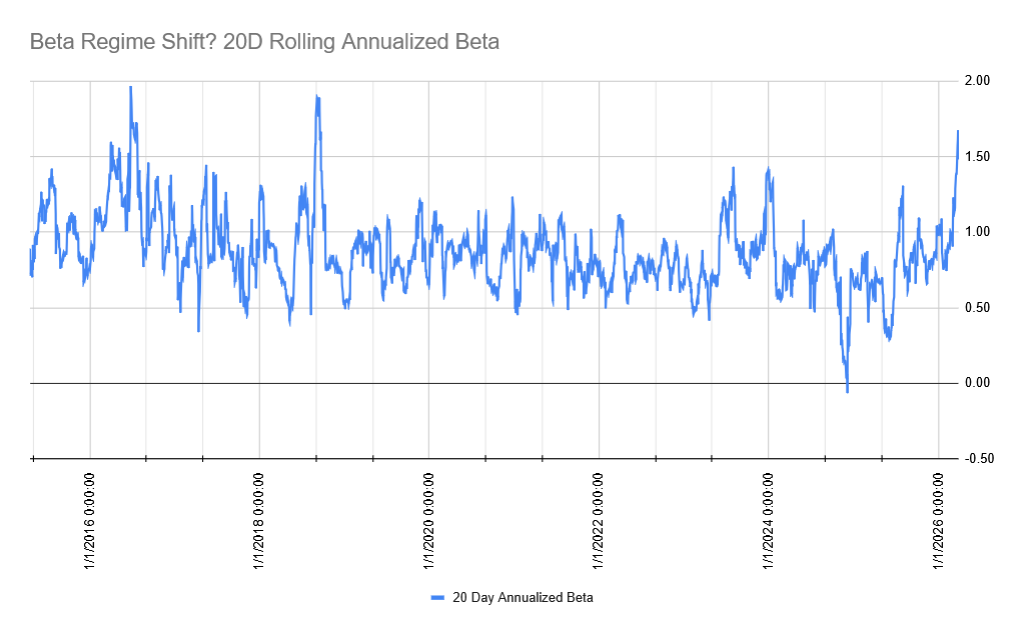
Source for ACWX ETF Rolling 20Day Beta vs SPY ETF: Google Gemini Finance as of 3/27/2026
6. Key Takeaways of Rising Beta between ACWX and SPX 500:
CIOs that were overweight global-exUSA stocks at the start of the year have seen the script flip 180 degrees.
With ACWX ETF beta to SPX 500 Index now over 1.50, this reduces MSCI ACWI ex-USA Index Diversification Utility from a Broad Beta Perspective for the index which has $3 Trillion benchmarked to it per MSCI.
Insight: given many Asset Managers and Asset Owners allocated to International ex-USA as an overweight at the start of the year, major trimming will likely need to be done with ACWI ex-USA/FTSE ex-USA OW exposures before first quarter end due to the rising drawdown volatility and increased correlations to SPX 500 index.
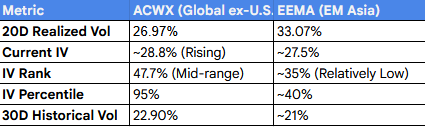
ACWX has recorded a significant volatility expansion, making it an expensive but high-conviction play for optionality on a potential log-step jump in realized volatility:
March 2026— Month-End Performance Review: KSA+EIS Delta Neutral Barbell Delivered Superior Absolute & Risk Adjusted Results vs MSCI EM Asia Index (EEMA ETF as Proxy)—
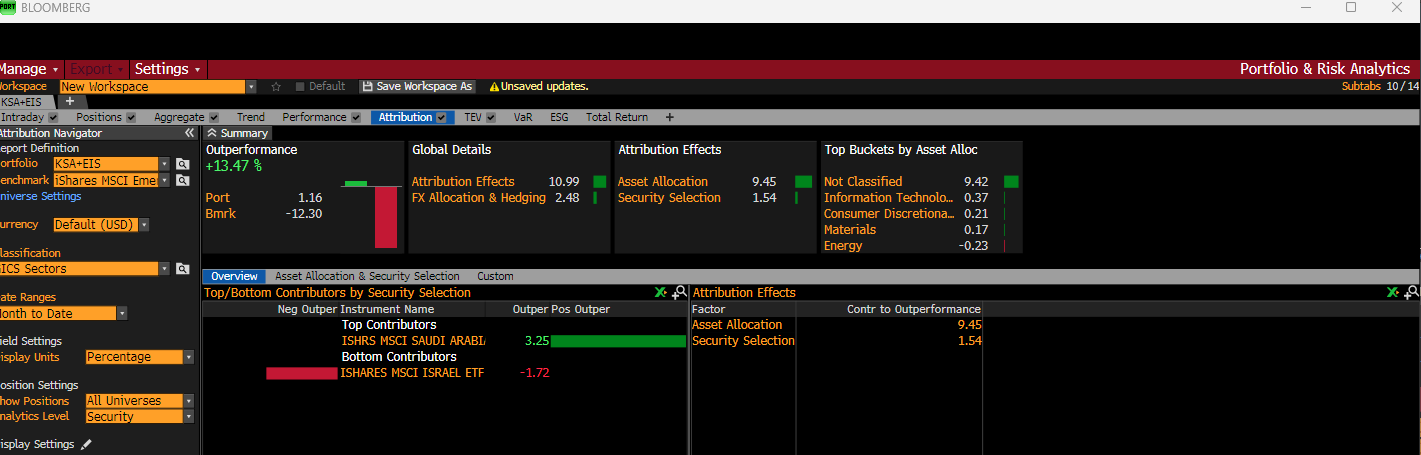
According to Bloomberg PORT, a portfolio of 70% KSA ETF and 30% EIS ETF— which is reflective of their generic Feb 2026 month end market cap contributions to MSCI ACWI ex-USA Index— generated 13.47% excess return vs iShares EM Asia ETF (EEMA). On 8 March 2026, DuLac Capital Advisory L.L.C. projected institutional asset managers and asset owners would indeed overweight the pair (MSCI Israel and MSCI Saudi Arabia via ETFs for interim beta) relative to constituents (EEMA ETF).
Why? Pension Fund CIOs and Hedge Fund PMs sought to gain optionality with their EEMA positions given their historically negative beta to Brent Crude Oil. EEMA ETF has recorded over $570MM in net outflows over the past month.
Source: Bloomberg Terminal as off 3/31/2026
MSCI Saudi Arabia as Represented by Interim Beta Instrument, iShares MSCI Saudi Arabia ETF (KSA) Delivered Over 16% off Outperformance vs EEMA ETF, before Credit Collar Option Overlay Strategies Are Even Accounted for—
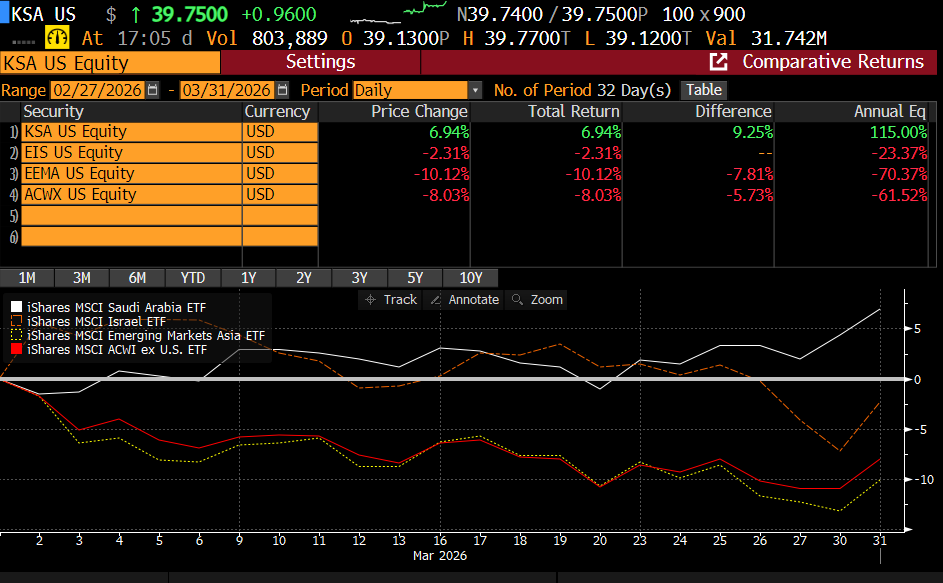
Source: Bloomberg Terminal as of 3/31/2026
Optionality via ACWX overlay Strategies and EEMA Security Lending
EEMA’s IV is actually lower than ACWX’s right now, which is historically rare. This indicates a relative "volatility discount" in Asian emerging markets– which tend to be commodity shock sensitive– compared to the broader global ex-USA basket.
ACWX Observation: The 95% IV Percentile is the "red flag.” It indicates ACWX options have been cheaper than this for 95% of the last year. You are paying a high premium to enter now. However, the current price is down ~11% from its February high, suggesting the market is already pricing in a "downside skew."
EEMA Observation: EEMA’s IV is actually lower than ACWX’s right now, which is historically unusual. This suggests a relative "volatility discount" in Asian emerging markets compared to the broader international basket. For structurally net long institutional investors seeking to hedge the rising beta with their MSCI ACWI-exUSA exposure, shorting $1B AUM EEMA ETF may be as optimal as stitching together a basket of single name securities in the commodity shock sensitive index…..
Please reach out for the rest of this Thought Piece. DuLac Capital Advisory L.L.C. specializes in tech-enabled investment due diligence and portfolio efficiency consulting for institutions. If there's interest in deeper validation, scenario modeling, or bespoke product due diligence on related ETF/index strategies (e.g., stress-testing barbell allocations under prolonged energy disruptions), we’ll be happy to facilitate an introductory discussion with their team to explore potential collaboration.
Contact
DuLac Capital Advisory—Independent index solutions due diligence for asymmetric event risk.
ryanScott@dulaccapitaladvisory.com | +1‑516‑838‑6833
**Investment News, Market Insight, and Investment Insight Disclaimer**
The information, investment news, and policy insights provided by DuLac Capital Advisory L.L.C. ("the Firm") through its publications, reports, newsletters, and communications, including but not limited to Investment News, Market Insight, and Investment Insight, are intended for informational and educational purposes only. These materials are not to be construed as specific investment recommendations or advice. DuLac Capital Advisory L.L.C. is a technical services management consultant for companies and institutional investors. DuLac Capital Advisory L.L.C. does not receive any revenue from any company or service mentioned in this insight piece.
**Not Investment Advice:**
The materials provided by the Firm do not constitute investment advice or recommendations to buy, sell, or hold any securities or investment products. The insights offered are general in nature and do not take into account the individual circumstances, investment objectives, risk tolerance, or financial situation of any particular institutional investor or recipient.
**No Reliance:**
Institutional investors should not rely solely on the information provided by the Firm for making investment decisions. It is recommended that investors conduct their own due diligence, seek advice from qualified financial professionals, and carefully consider their investment objectives and risk appetite before making any investment decisions.
**No Guarantee:**
While the Firm strives to provide accurate and up-to-date information, there is no guarantee of the accuracy, completeness, or reliability of the information provided. The financial markets and economic conditions are subject to change, and the information provided may become outdated or irrelevant over time.
**Risk Disclosure:**
Investing in financial markets involves inherent risks, and the value of investments may go up or down. Past performance is not indicative of future results. Institutional investors should be aware of the potential risks associated with investment decisions and should consult with professionals who are qualified to provide personalized investment advice.
**No Endorsement:**
Any mention of specific securities, investment products, or companies does not constitute an endorsement, recommendation, or promotion of those securities, products, or companies by the Firm. The inclusion of any such information is for informational purposes only. No compensation was received from including any investment product or technology into the White Paper.
**Legal and Regulatory Considerations:**
Institutional investors are responsible for understanding and complying with all applicable laws, regulations, and guidelines related to their investment activities. The Firm's materials are not intended to replace or substitute for legal or regulatory advice.
The Firm disclaims any liability for the use or interpretation of the information provided in its materials. Institutional investors should use their judgment and exercise caution when relying on any information provided by the Firm.
For personalized investment advice tailored to your individual circumstances, we strongly recommend consulting with licensed financial advisor at a major Wealth Manager.