

Institutional Investors May Use KSA and EIS ETFs in a Barbell Strategy to Gain Optionality on Mideast “Crash Out” Concerns (Updated 3/31/26—Short Interest, Oil Beta, and Attribution)
Bottom Line Up Front
As the uncertainty of the war breaks out, these ETFs (TUR, KSA, UAE, QAT, EIS) should provide timely hedging vehicles for professionals this week— and over the coming months as investors implement various asymmetric capture long-short delta neutral strategies.
Liquidity, options availability (e.g., TUR, KSA) , and improving microstructure offer cleaner entries and better expression of relative risk.
We expect investors to barbell “crash out” concerns by pairing optionality on EIS (Israel) and KSA (Saudi Arabia)—fading tail risk via covered collar strategies, and capturing robust tech and energy pipeline exposure, similar to the June 2025 period following MOAB deployment on Iran’s nuclear sites.
This strategy may play out especially relative to commodity sensitive MSCI EM Asia and MSCI Europe IMI.
Context and Rationale
In the aftermath of the tragic 2023 Hamas attack, DuLac Capital Advisory anticipated institutional demand to buy Israeli public equities into downside volatility and dislocation.
U.S. state pension flows to Israeli sovereigns supported the market’s cost of capital, stabilizing the backdrop for risk assets.
Two and a half years later, MSCI Israel has been among the stronger DM country exposures—reflecting underappreciated depth in technology and financials.
Strategy Setup: Barbell Optionality
Core idea: Pair optionality on EIS (MSCI Israel- capped IMI) with optionality on KSA (MSCI Saudi Arabia-25/50 capped IMI) to balance “crash out” tails against resilience/recovery— especially with under-appreciated MSCI EM Asia and MSCI Europe commodity shock risks (circa 2022 trade).
Instruments:
Israel: iShares MSCI Israel Capped IMI ETF (EIS)
Saudi Arabia: iShares MSCI Saudi Arabia ETF (KSA), in which listed options are available.
Complementary exposures: TUR (Turkey), UAE (UAE), QAT (Qatar) as satellites for dispersion or added liquidity
Why now:
Listed options markets in KSA have matured, improving price discovery and execution quality.
Additionally, custom dealer index swaps on EIS’ primary index, enables optionality as well for the tech heavy MSCI Israel IMI market.
Liquidity is deeper, with tighter screens and better capacity for institutional blocks.
Cross‑regional correlations remain unstable—creating relative‑value edges for disciplined hedging programs.
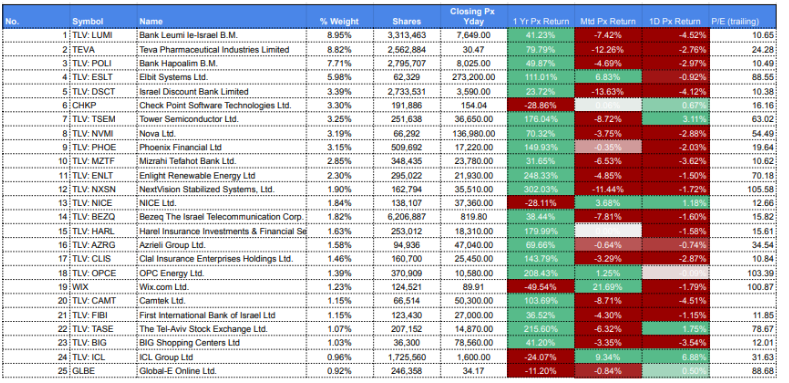
Lastly, many of the top ten underlying holdings for EIS ETF have options trading on US Exchanges— see table below:
For EIS, 50% of the top ten holdings have US Listed Options per NADAQ
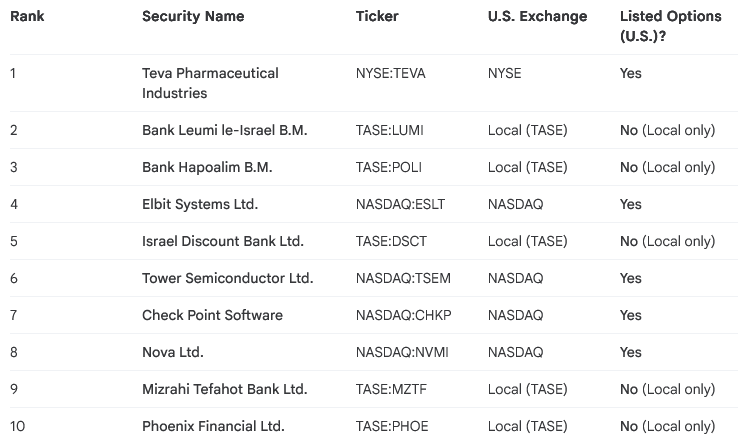
Source: Data based on iShares.com holdings data, Google Finance, and NASDAQ option chain reports as of March 2026.
Evidence and Market Behavior
In the six months post‑attack, EIS creations were muted—investors replicated the index via underlying names, effectively a “core–satellite” approach for risk management of other commodity sensitive MSCI DM-exUSA and MSCI EM structural long exposures.
Institutions using EIS as a core sleeve with satellite overlays of top alpha generating ideas generated attractive risk‑adjusted returns versus an 80/20 benchmark (e.g., iShares Aggressive Allocation ETF, AOA).
See prior perspective:
Americans Must Divest From Hamas: A Modern‑Day Nazi SS Group
https://www.dulaccapitaladvisory.com/blog/americans-must-divest-from-hamas-a-modern-day-nazi-ss-group
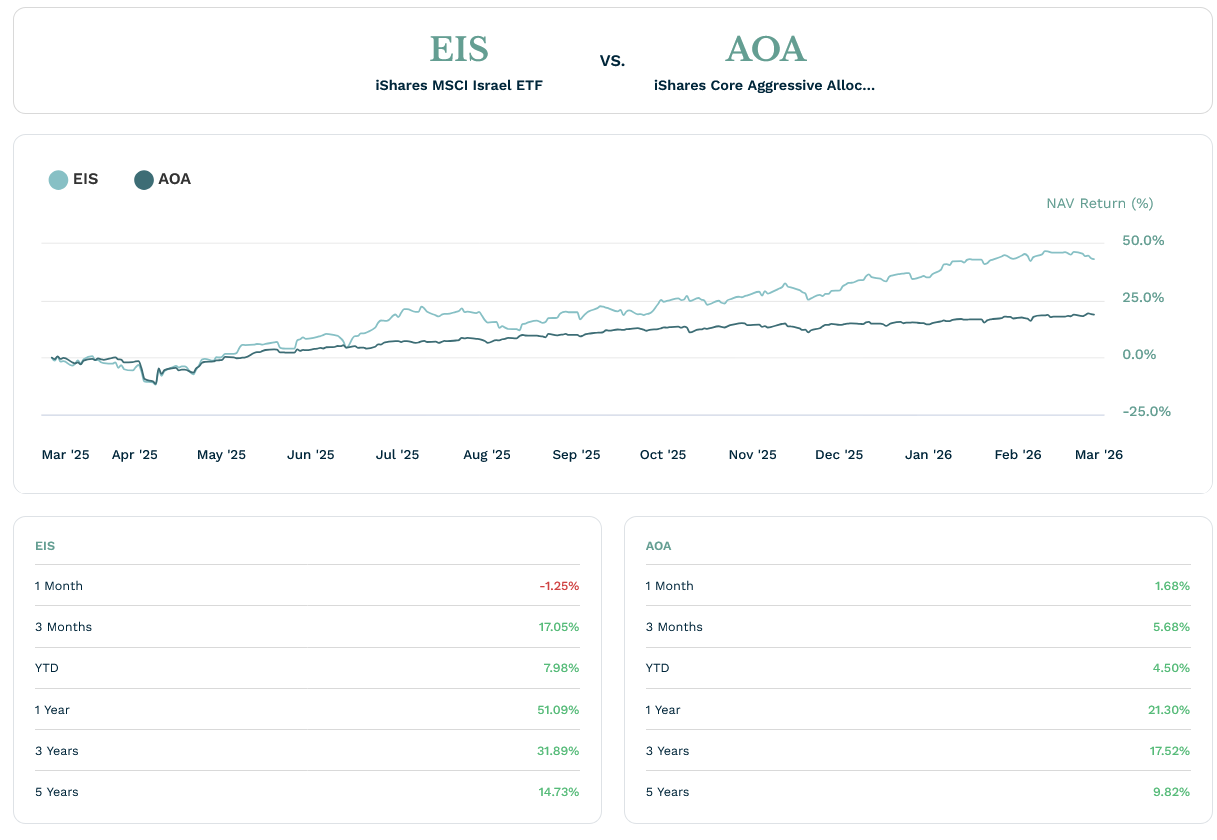
(source: ETF.COM as of 3/2/2026). iShares MSCI Israel ETF (EIS) has delivered strong risk adjusted returns vs a 90/20 ETF benchmark since the tragic 7 October Hamas attacks. Additionally, institutional investors have found liquidity, beta management, growing options market, and cash drag mitigation solutions via single country ETFs in addition to broker dealer custom basket and swap solutions.
Execution Considerations
Structures: Verticals to define risk; calendars/diagonals around catalysts; collars atop cash exposures where applicable.
Sizing: Budget premium as bps of portfolio risk to avoid path dependency.
Triggers: Geopolitical path, policy signaling, FX stability, and market microstructure (creations/redemptions, borrow, implied vols). For example per annual statements, most international iShares country focused ETFs spot FX risk in London at 4 PM GMT.
This could create FX tracking error risk in the US listed ETF during times of local market since the US market still trades another 4-5 Hours.
Monitoring: Primary/secondary liquidity, options skew/term structure, and creation/redemption activity.
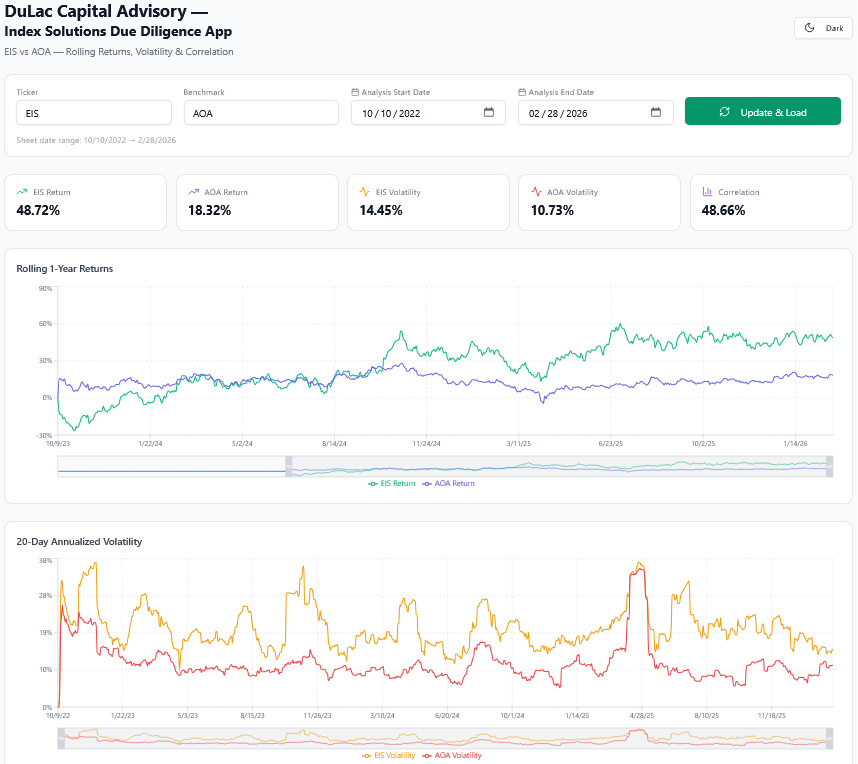
iShares MSCI Israel IMI (capped) ETF (EIS) has delivered strong risk adjusted returns on an absolute basis and verses a index tracking ETF of 80/20 stocks-bonds, AOA. Source: DuLac Capital Advisory, Google Finance API, Base44, ishares.com
GenAI Due Diligence Constraints
DuLac Capital Advisory identified limitations and unintended biases when using GenAI to assess revenue exposure to Qatar and other country constitutes for iShares international ETFs May have to Iran.
Examples:
False positives included Nestlé and Tawain Semi at “10% Qatar revenue.” These were hallucinations.
Halliburton (HAL) surfaced in Bard/Gemini outputs despite longstanding sanctions—an implausible result.
Why it matters:
ETF primary/secondary mechanics and regional FX convertibility constraints—plus non‑standard trading calendars (e.g., Saturday trading)—require verified inputs, not model conjecture.
DuLac Capital Advisory L.L.C. performed a revenue contribution screen for large cap companies using Google Bard— and found Bard AI hallucinated incorrect information currently with a prompt to identify publicly traded companies that receive 20% or more of their revenue from Iran:

DuLac Capital Advisory L.L.C. does Gen AI prompt engineering and evaluation for investment managers— Google-Bard AI is incorrect in this prompt request to identify companies that derive 20% or more of their revenue from Iran.
Further reading:
Gen AI Constraints in Hamas Divestment Screens
https://www.dulaccapitaladvisory.com/casestudies/dulac-capital-advisory-identified-constraints-with-genai-for-hamas-divestment-strategies
Operational Checklist for Institutions
Define objective: tail‑risk hedge vs. relative value vs. convex carry.
Select wrappers: EIS/KSA core; TUR/UAE/QAT satellites for regional nuance and asymmetric downside risk capture to balance existing long positions within MSCI EM and MSCI EMEA.
Pension and Endowment funds can consider robust security lending of liquid iShares regional and country focused ETFs; the prospectus for EIS, for example, says security lending requires government securities collateralization and is max of 33 1/3rd% of NAV.
Choose structures: spreads, calendars, or collars based on catalyst map.
Governance: pre‑clear trade rationales; set unwind/roll rules; monitor creation/redemption signals.
Bottom Line
A disciplined barbell using options on EIS and KSA can provide targeted optionality around Mideast “crashout” scenarios while preserving upside participation. Liquidity, options depth, and improved microstructure now support institutional execution.
Update (3/8/26)—KSA/EIS Barbell Strategy for Optionality for Mideast Contagion Risks
DuLac Capital Advisory L.L.C. published this thought piece on The "EIS/KSA Barbell Strategy" last Monday 3/2/2026. The pair combination ended up being one of the few “places to hide” for institutional investors that must remain structurally long the market due to benchmark mandates, such as endowment funds and pension funds.
This investment insight piece was designed to help institutional investors manage risk and maintain liquidity during the systemic commodity supply chain shocks caused by the closure of the Strait of Hormuz and possible underlying market closures— which ended up happening in UAE due to IRGC kinetic attacks.
These industrial infrastructure supply chain attacks and Strait of Hormuz closure has acted as a "systemic input cost tax" on energy-dependent manufacturing hubs in Emerging Market (EM) Asia and Developed Europe. The strategy utilizes a barbell of the iShares MSCI Israel ETF (EIS) and the iShares MSCI Saudi Arabia ETF (KSA) to act as a "volatility sponge".
However, much of the easy absolute returns are probably in the rear view mirror in the short term as investors must now consider the uncertainty of not only the duration of the blockade of Hormuz but also damages to the GCC member state supply chain infrastructure. Nonetheless, the approach should still generate strong risk adjusted returns relative to commodity shock sensitive MSCI DM-exUSA and MSCI EM/DM Asia over the short and medium term.
We go deeper with due diligence into these topics and provide investment insight on risk management with ETFs and other index solutions in my latest piece published Sunday 3/8/2026: Update– EIS/KSA Barbell Strategy: ETF/Index Maxxing for Beta Management and Optionality during Rising Mideast Energy Supply Chain Disruptions
Update- (3/12/2026): Institutional Due Diligence Signals: Deciphering Mideast ETF Creation/Redemption Case Studies Amidst Hormuz Strait Volatility
Quick Take: By pairing MSCI Israel (EIS) and MSCI Saudi Arabia (KSA), institutional allocators effectively isolated a tech-energy dispersion trade that neutralized directional exposure to the IRGC conflict: in the first 10 Days the implied volatility spiked for the two ETFs as predicted, yet the realized never converged– creating option premium harvesting option overlay strategies for these important constituents of MSCI DM-exUSA (EIS) and MSCI EM (KSA), respectively. Examining creation/redemption signals juxtaposed to ETF volatility is telling– for instance, for iShares MSCI Kingdom of Saudi Arabia ETF: KSA, redemption of outstanding shares has been muted up to March 10, 2026– despite a near 40% rise in realized 20D volatility.Details:
Neutralizing Directional Risks: By pairing iShares MSCI Israel ETF (EIS) with iShares MSCI Saudi Arabia ETF (KSA)-- in a delta neutral format, via options overlay (via the underlying constituents of EIS and actual options on KSA)– institutional allocators established a tech-energy industry factor (growth and value+catalyst combo factors) dispersion investment strategy that effectively hedges against directional exposure to IRGC-related conflicts, focusing instead on sector-specific divergences.
Benchmark Relevance: EIS serves as a key constituent in the MSCI Developed Markets ex-USA Index, while KSA plays a growing role in the $12 Trillion market cap MSCI Emerging Markets Investable Market Index (IMI), making this pair particularly strategic for diversified global portfolios.
Volatility Spike and Option Overlay Opportunities
Implied vs. Realized Divergence: In the first 10 days of the period, implied volatility for both EIS and KSA spiked as anticipated due to heightened tensions; however, realized volatility did not converge, presenting alpha-generating opportunities.
Premium Harvesting Strategies: This mismatch enables option overlay tactics, such as harvesting premium through structured products or volatility trades, tailored for pension funds, endowments, and hedge funds seeking non-correlated returns.
EIS/KSA barbell strategy and Mideast "crash out" concerns, this reflects elevated demand for protective puts, potentially neutralizing directional IRGC conflict risks but amplifying opportunities for volatility harvesting– especially when compared with upside calls on existing positions of EIS:
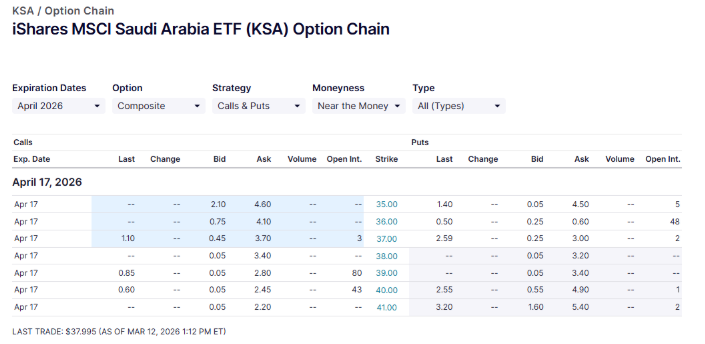
KSA ETF Options Liquidity is growing—Source: NASDAQ.COM as of 3/12/2026 at 510 GMT
Creation/Redemption Signals as Beta Management Indicators
Muted Redemptions in KSA Despite Volatility Surge: For the iShares MSCI Saudi Arabia ETF (KSA), redemptions of outstanding shares remained subdued through March 10, 2026, even amid a nearly 40% increase in 20-day realized volatility.
Deciphering Creation/Redemption Signals for iShares Saudi Arabia ETF KSA During Volatility and Volume Spikes– Muted Redemptions Despite 40% Vol Rise
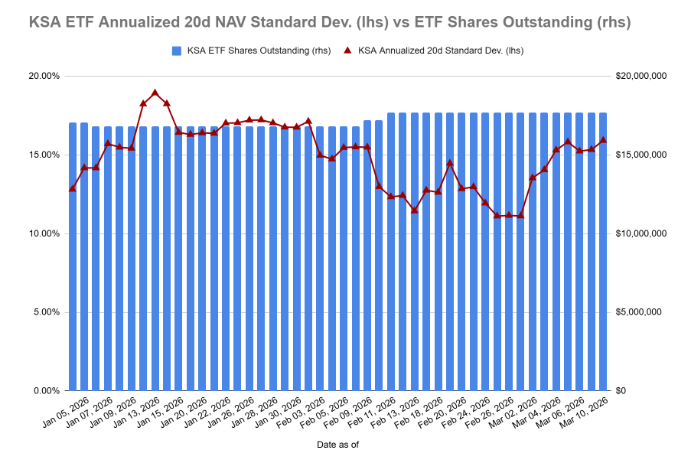
KSA ETF creation/redemption signals are important factors for institutional investor due diligence. Source: iShares.com, Google Finance Gemini as of 3/10/2026
Deciphering Creation/Redemption Signals for iShares MSCI Israel (25/50 capped) ETF (EIS) During Volatility and Volume Spikes– Muted Redemption Despite ~50% Vol Spike
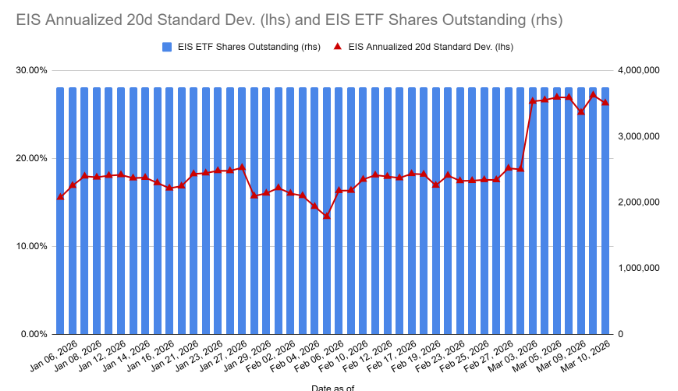
EIS ETF Creation/Redemption signals are important for institutional investor due diligence on this fast growing tech/finance heavy MSCI DM exposure. iShares MSCI Israel (capped) ETF (EIS) creation/redemption and volatility data as of 3/10/2026. Source: iShares.com, Google Finance Gemini as of 3/10/2026
Institutional Usage Patterns: This trend suggests that CIOs and PMs leveraged KSA not merely for liquidity provision but as a tool for beta management during turbulent markets, allowing precise exposure adjustments without forced selling.
Implications for ETF Traders and Asset Managers: Sell-side derivative traders and Authorized Participants monitor these signals to anticipate flow-driven price impacts, optimizing arbitrage and market-making activities in EM-focused products.
EIS/KSA Creation/Redemption Signal Key Takeaway: These charts indicate institutional investors used the KSA and EIS ETFs as part of barbell hedging strategies–not for not just liquidity management but for beta exposure paired with options overlay strategies to capture both ends of extreme spectrum that not even the best war strategist advisor could predict.
KSA- Growing Contribution to MSCI EM: This case study is especially important given KSA’s growing importance in the $11 Trillion market cap MSCI EM IMI— and MSCI Israel IMI’s growing importance in AI tech, miltech, and health care innovation.
Summary–EIS/KSA Barbell Update Industry Factor Exposure :
The global sell-off in Pharma Impacting MSCI Israel: Institutional investors utilized options overlay strategies for their MSCI Israel exposure by incorporating collars on underlying constituents: 50% of the constituents in EIS have listed options in the US per NASDAQ. However, the WSJ reported that there has been a broad sell-off with many pharma names as concerns about headwinds to their Mideast GCC growth strategies emerge. The largest
EIS Healthcare exposure as acted as a delta detractor– thus raising prospects for convexity capture through options overlay strategies as projected on 3/2/2026
Source: Google Gemini Finance, Stockanalysis.com as of 03/12/2026 at 5PM GMT
Conversely, KSA ETF’’s top underlying constituents:
KSA ETF has outperformed EM beta exposure from a delta perspective month to date (mtd)– this implies many institutional investors could be selling OTM calls option strategies on EIS, and buying OTM downside protection on the much larger market of Kingdom of Saudi Arabia–betting that may continue to target its energy infrastructure, but will likely not impact its innovative pipeline that empties to the Red Sea:
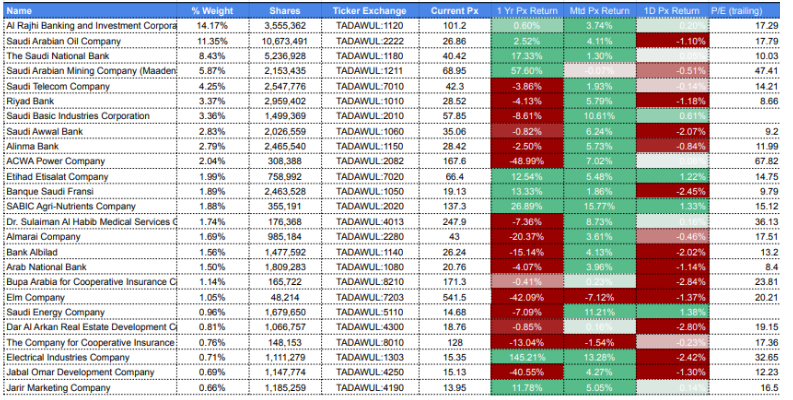
Source: Google Gemini Finance, Stockanalysis.com as of 03/12/2026 at 5PM GMT
2. ETF Resilience: UAE Liquidity Acts as a Vital Volatility Buffer Amid Regional Market Closures and Unprecedented Attacks on Dubai by IRGC:
Despite the UAE equity market closure on Monday-Tuesday this past week, iShares MSCI UAE ETF (UAE) continued to trade– providing institutional investors liquidity, beta management, cash drag mitigation, and collateralized security lending (the ETF and underlying) benefits during the turmoil.
UAE's Rising Role in MSCI EM: UAE has been a growing constituent of MSCI EM– comprising nearly a similar share as traditional EM heavy weight, MSCI Turkey (TUR) over the last year.
High Trading Volume in UAE ETF in spite of Market Closure: Despite the underlying market being closed in UAE due to IRGC missiles and drones attacking its industrial and hospitality centers, over 4 Million shares traded on Monday 3/3/2026 in the US listed ETF: vs ~114K avg per NASDAQ.
ETF as a Tool for Beta Management in Crises: Thereby providing institutional investors a helpful use case study in ETF beta management during volatility, volume, and convexity spikes– even if the underlying market is closed for a short period due to unforeseen events.
Limited Redemptions Amid Volatility Spike: Finally, many investors would expect massive redemptions considering the realized and implied volatility spike Dubai’s market and its associated ETFF iSHares MSCI UAE ETF (UAE). The opposite was the case– since the war broke out, as of Wednesday 3/11/2026, only approximately 250K shares have been redeemed– out of 10,950 outstanding on March 6, 2026 just prior to the redemption.
For iShares UAE ETF (UAE) Orderly Creations AND Redemptions Have Both Occurred since the War Broke out– this is despite Nearly 80% Realized Volatility Spike
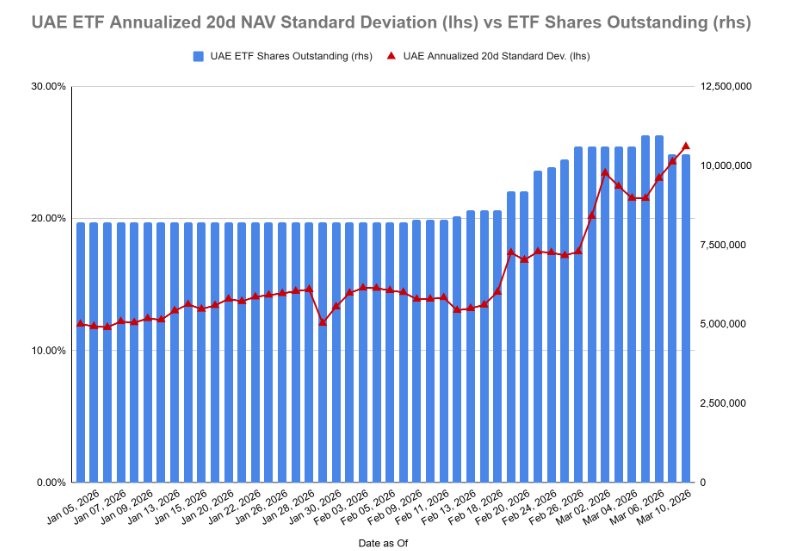
iShares UAE ETF (UAE) creation/redemption and volatility data as of 3/10/2026. Source: iShares.com
ETF Redemptions as Volatility Mitigators This ~6% share outstanding redemption shows the institutional use case for liquid country ETFs as a mitigator against tracking difference during volatile times– the redemption indicated the ETF market price began began trading at a discount to fair value NAV (per prospectus, BlackRock Fund Advisors may provide fair value accounting for NAV of ETFs when the underlying market is closed)--
Creation/Redemption Signals with UAE ETF During USA-IRGC War: In other words, too much supply of the ETF shares relative to the demand for the value of the underlying stocks means Authorized Participants have an opportunity to do an in-kind redemption for the shares of the ETF in exchange for the underlying stocks, trading at more attractive valuations relative to the shares of the ETF. This is a key factor why ETFs do not trade at discounts or premiums for too long– a stark contrast in comparison to closed end funds (CEFs).
MSCI ACWI-exUSA IMI Index– GCC plus Israel Exposure by Market Cap Component (as of 02/28/2026): UAE is the Second Largest GCC Exposure and Third Largest Mideast EM:
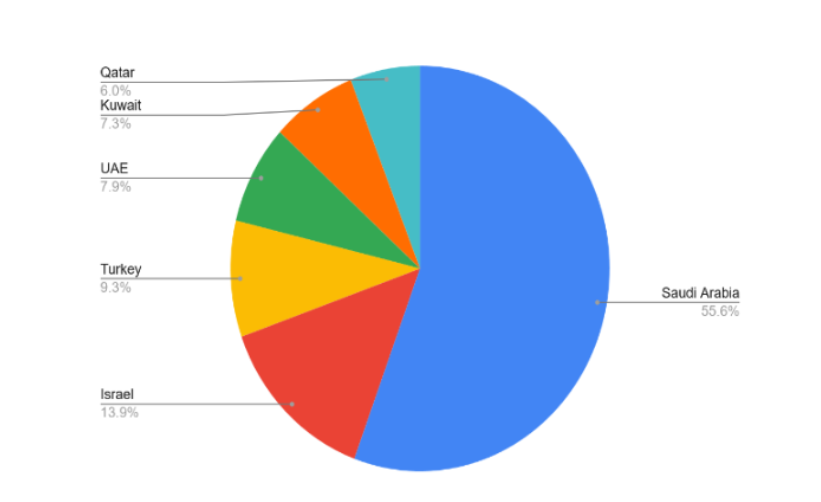
MSCI UAE is nearly 8% of GCC plus Turkey and MSCI Israel by market cap as of 02/28/2026— too large to ignore from a beta management perspective. Source: MSCI and Google Gemini as of 2/28/2026
Summary on UAE ETF as Institutional Instrument:
The fact that after the war started, there were 350,000 shares created between the 4th to 5th of March 2026 indicates institutional investors were able to quickly access Dubai equity exposure via its most liquid US listed ETF, iShares UAE ETF (UAE). The market signals changed fast during the first 6 US trading days of the war– and UAE ETF performed well as an institutional instrument for institutional investors seeking exposure, no matter long or short, to this significant GCC constituent in MSCI EM EMEA.
4. UAE, KSA, QAT, EIS, and TUR as part of Core-Satellite strategies and Index + Active Sleeves:
UAE and TUR were among the worst performing MSCI EM EMEA ETFs in the first 5 days of the way on an absolute and risk adjusted basis. For MSCI UAE Index exposure, concerns emerged about the IRGC’s attack on not only its energy infrastructure, but also industrial, tech, and even civilian infrastructure. This impacted its finance and banking sectors heavily.
Turkey Military Base Attacked by IRGC: For MSCI Turkey index exposure, concerns emerged following the strike on the NATO’s territory Western military base that hosts US Troops– and its sensitivity to commodity supply shocks. Turkey is an energy importer and has long run trade deficits– this does not bode well for its FX risk relative to the USD.
Commodity Shock Sensitivity of TUR ETF: Let alone consumer spending in this demographic rich state. Reports have emerged that despite Turkey being a largely Islamic country, with a largely Islamic government, it even has 15 associated energy tankers stuck in the Persian Gulf– daring not to pass the Strait of Hormuz given the most IRGC warning to any sovereign state that hosts USA or Israel Officials or troops.
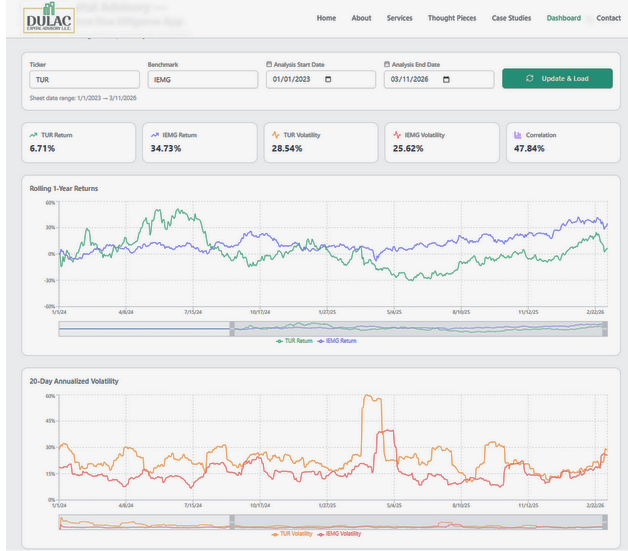
Volatility Profile Similar to MSCI EM: TUR ETF has had a similar volatility profile over the last year as MSCI EM IMI (IEMG), indicating it benefited from 2025’s rising tide lifts all energy-sensitive EM “boats” amid that year’s USD weakness and low commodity costs vs long term average.
MSCI EM Asia Like Drawdown in First Week of War: The IRGC blockade of they Hormuz Strait though changes that trade dynamic– and thus investment risk profile. Hence, TUR ETF performed more like an energy sensitive Asian EM index proxy during the first week of the war– experiencing a sharp drawdown of approximately 7.16% on a price basis from peak just before the war, to trough on March 9, 2026– benefiting near the end of the trading day announcement by President that the “war will be over soon.”
MSCI Turkey Index proxy ETF, iShares MSCI Turkey (TUR), has recorded a rise in volatility in near tandem with MSCI EM IMI Index tracking ETF, IEMG—
iShraes MSCI Turkey ETF and iShares MSCI Core Emerging Market ETF (IEMG) hvae similar vol profiles. Source: Google Finance Gemini, iShares.com,Base44.app as of 03/11/2026
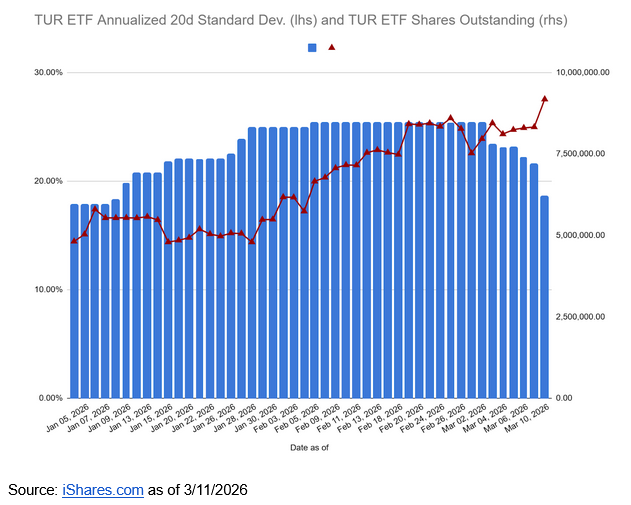
Redemptions During first 10 Days- Very High: iShares MSCI Turkey ETF (TUR) experienced a near 26% redemption in shares outstanding since the start of the war– this is a significant indicator of institutional exposure to commodity shock sensitive EM countries. Additionally, the realized volatility profile for TUR ETF nearly doubled since the average at the start of 2025.
As Realized Volatility Spiked ~80%— Investors Redeemed close to 25% of ETF’s End oF February 2026 Net AUM!
Bottom Line: This means institutional investors may transition to active strategies to capture MSCI EM and MSCI DM-exUSA exposure– especially with custom dealer baskets that may de-weight the health care industry factor in ETFs such as KSA, EIS, QAT, TUR, and UAE. Nonetheless, DuLac Capital Advisory continues to expect EIS and KSA to provide liquid hedging and beta management utility for structurally long institutional investors.
Update- (3/26/2026): Institutional Due Diligence Signals: Deciphering Mideast ETF Short Interest, Brent Crude Beta, and Tracking Error Signals Amidst Hormuz Strait Vega Risk Uncertainty
Tail Risk Hedging— MSCI Index Country ETFs for Rapid Beta Exposure During Volatility Regime Shifts
In a Wednesday 25 March 2026 post by financial news website, Zerohedge.com, "Insane Moves in ETFs As Single-Stock Liquidity Disappears", the author summarizes a Goldman Sachs ETF Research desk note that stated: " ETFs are currently experiencing their most outsized month of trading volumes, averaging 37% of the overall tape. Monday marked the 3rd-busiest session in terms of ETF share of the tape, at 42%, with Tuesday's session just above 40% (as a reminder, ETFs are largely used to hedge long exposure via single stocks by institutions/hedge funds). Short exposure in macro products has lingered near 5-year highs in the Goldman Prime Brokerage book."
The use of ETFs for rapid beta exposure, "core-satellite" asymmetric event risk capture, and cash drag mitigation by institutional investors exposure during potential volatility regime shits— such as a Mideast "Crash Out" risk caused by the war— was a trend that we predicted on the morning of 2 March 2026 at Dulac Capital Advisory L.L.C.
With proof now in the pudding, institutional investors have asked us details on short interest, tracking error, and oil beta of two key GCC state ETFs: the iShares MSCI UAE ETF (UAE) and the iShares MSCI Saudi Arabia ETF (KSA). In our second update on ETF applications for underpriced Mideast "Crash Out" risks, we noted that the GCC states, MSCI Israel, and MSCI Turkey were too large constituents within MSCI ACWI exUSA to ignore-- with over $1.5 Trillion in combined market cap value at the end of February 2026 per MSCI. Institutional allocators find the most opportunity in markets where cross-asset/risk-factor correlations break down and beta dispersion widens.
Therefore evaluating the performance and liquidity profiles of the leading GCC State ETFs is a critical component of due diligence for managers seeking to navigate systemic volatility regime shifts. This enables institutional managers to focus on alpha generation rather than beta drag on their risk-adjusted return targets.
Short Interest for UAE and KSA-- Trending Higher, But Not Very Significant Compared to Other Macro Products:
Given Goldman Sachs ETF Research team noted that short interest (SI) for ET is near a 5 year high, one would reasonably hypothesize that there the short interest as a percent of shares outstanding for KSA ETF and UAE ETF would be extremely elevated since those nations have taken a brunt of the IRGC’s violence against civilian infrastructure. An examination of SI on the Bloomberg Terminal, however, belies that notion.
Short Interest on an absolute basis is at an all time high at 3.277 Million shares. However, it must be compared against total shares outstanding: only 1.87%-- a far cry from the 131% ratio recorded in June 2017 during the Qatar blockade. This indicates that strategic allocators tied to MSCI/FTSE global-exUSA benchmarks are still holding onto their long positions with the UAE ETF.
UAE ETF— Short Interest has Risen since Start of War: But still Less than 2% of Shares Outstanding
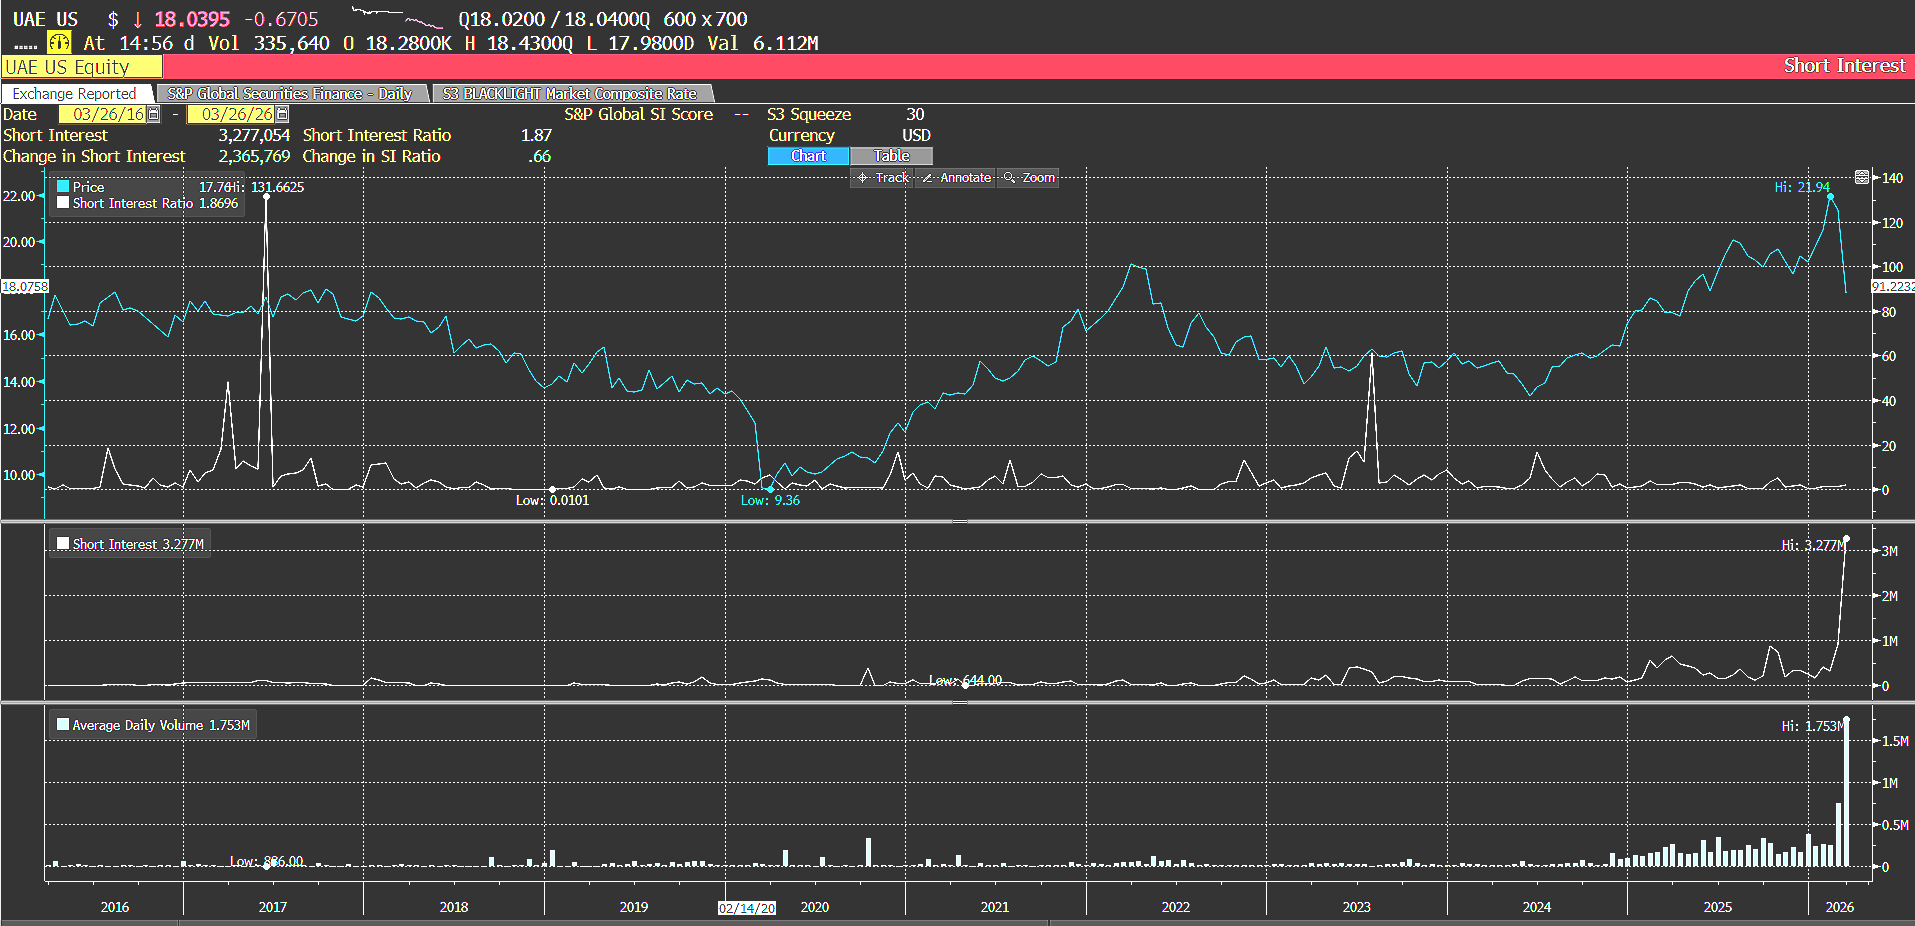
Source for UAE ETF Short Interest vs. Shares Outstanding: Bloomberg Terminal as of 03/26/2026
Likely some tactical Hedge Fund's have utilized the liquidity of UAE to manage a potential beta regime shift in the MSCI GCC exposure due to the IRGC targeting not just the GCC states' sovereign energy infrastructures-- but also their growing tech, hospitality, and industrial ecosystem such as the Amazon Data Center (according to the Wall Street Journal).
The Kingdom of Saudi Arabia has bravely incurred multiple attacks to its oil and industrial infrastructure. Recall in the previous update, DuLac Capital Advisory L.L.C. highlighted KSA ETF as not just a directional energy play, but rather a "toll booth" type of allocation due to its Red Sea port pipeline. Since then, the Wall Street Journal and Zerohedge has reported twice about its Yanbu Port at the Red Sea taking on capacity that could go upwards of 5MM bpd of oil.
This could be the reason why there is a disconnect between the performance of the underlying constituents of KSA ETF, which has been among the best performing on a risk adjusted basis month to date vs MSCI ACWI-exUSA, compared to the short interest as a percent of shares outstanding. Which currently stands at 4.7%-- higher than UAE ETF which is odd considering the significant risk-adjusted and absolute outperformance of MSCI Saudi Arabia vs MSCI ACWX-USA since the 2 March 2026:
KSA ETF— Short Interest has Risen as % of Shares Oustanding More than UAE ETF: But still Less than 5% of Shares Outstanding
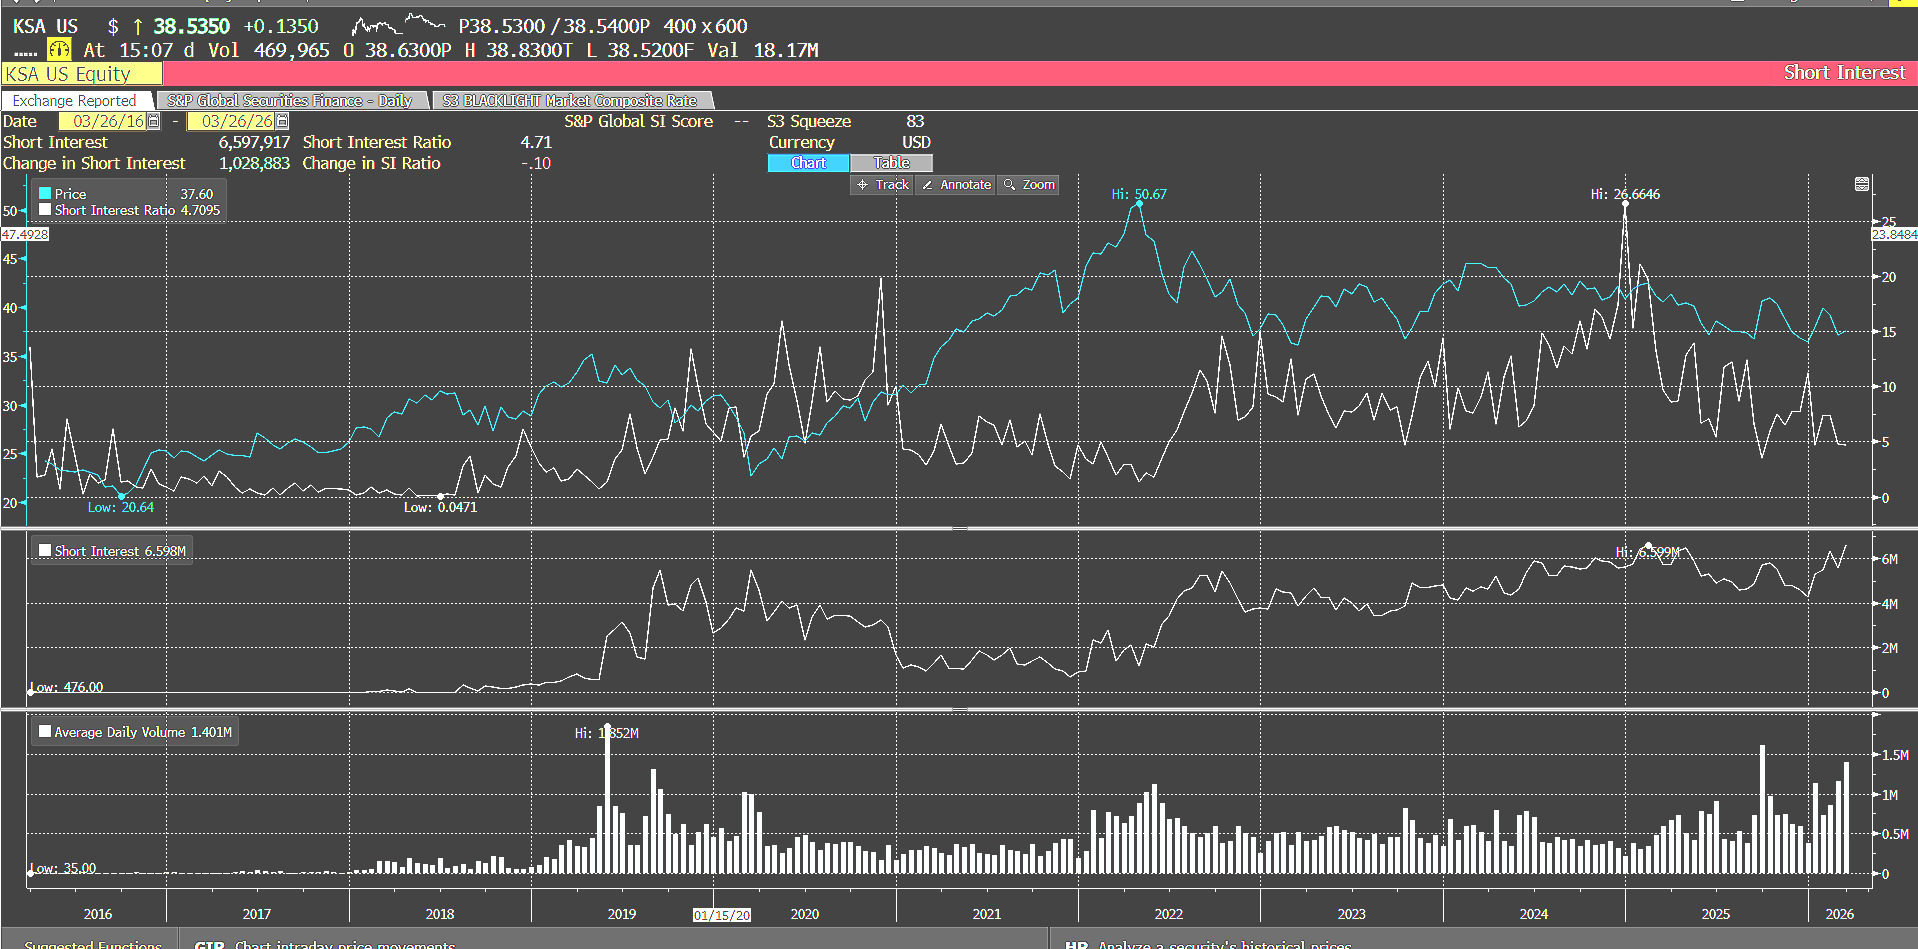
Source for KSA ETF Short Interest vs. Shares Outstanding: Bloomberg Terminal as of 03/26/2026
This IRGC targeting of GCC multi-sector infrastructure is perceived by the market as a potential beta profile gamechanger for the UAE and other Gulf states-- shifting them from a historical play on oil rich countries with budding tech ecosystems, to a geopolitical risk area that will have to undergo much infrastructure repair over the next 3-5 years due to the IRGC's damage. This shift in investment may cause leveraging of the economy which dampens earnings multiples-- hence the need for some tactical investors to manage this potential beta regime shift via shorting the most liquid of Gulf state ETFs, especially since futures and options aren't readily available.
UAE ETF Portfolio P/E Has Declined from 11.37X to 9.28x since 9/30/2024— The ~18% Decline Has Been Driven by IRGC Attacks Against its Industrial and Civilian Hospitality and Commercial Infrastructure
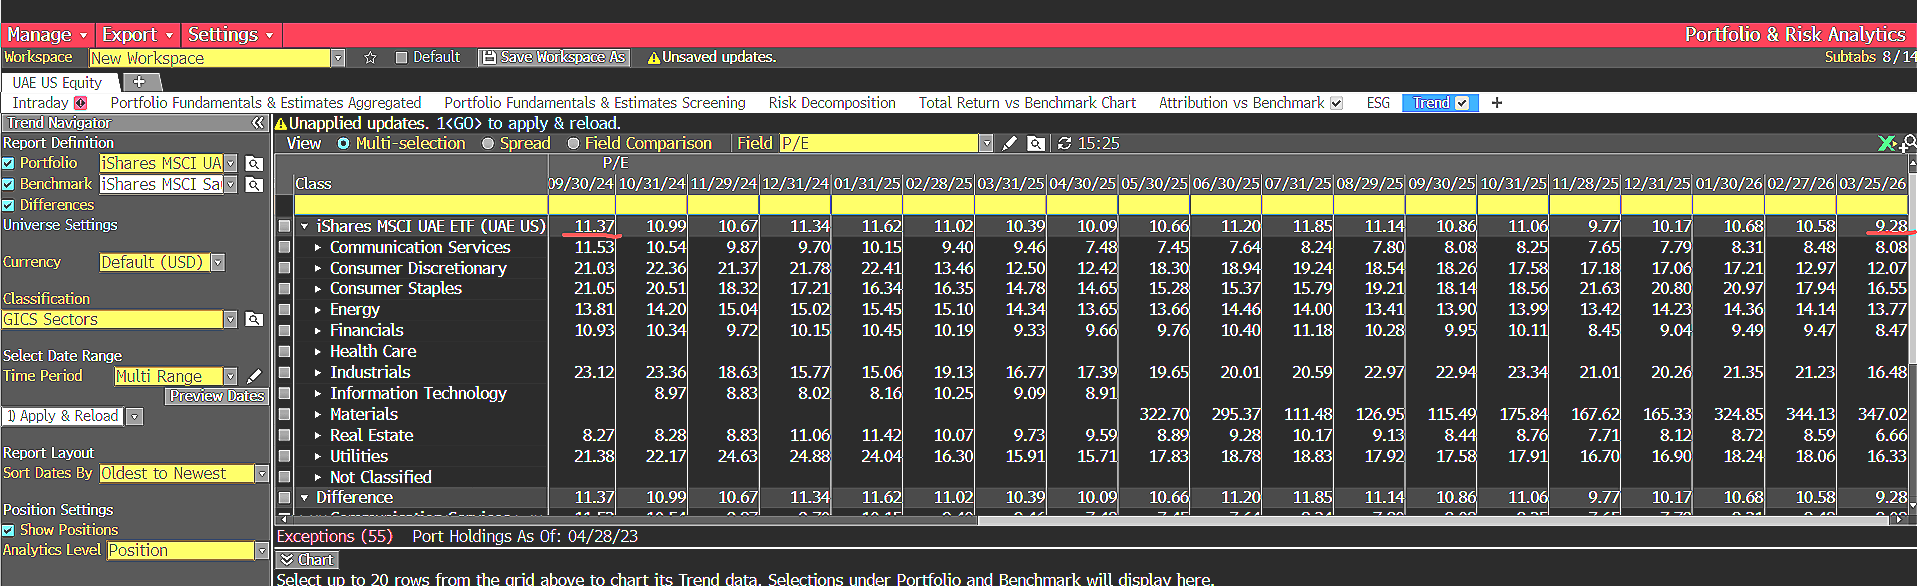
Source for historical portfolio level P/E of UAE ETF: Bloomberg Terminal as of 03/26/2026
Given the infrastructure damage, and the resulting dispersion in underlying stock performance as contagion fears spread, it may be helpful to take a step back and look at UAE ETF’s regression with Brent Crude Oil. Insititutional investors realize that eventually the pipeline play that has helped KSA ETF outperform MSCI ACWI-exUSA on an absolute and risk-adjusted basis may end up benefitting Emerati stocks as well once the smoke settles. Thus the dispersion play with UAE may end up reversing the other direction in the forseeable future.
Surprisingly, Trailing 12 Months (TTM), UAE ETF has recorded a low correlation with Brent Crude Oil and low explanatory factor. The raw beta is in fact negative.
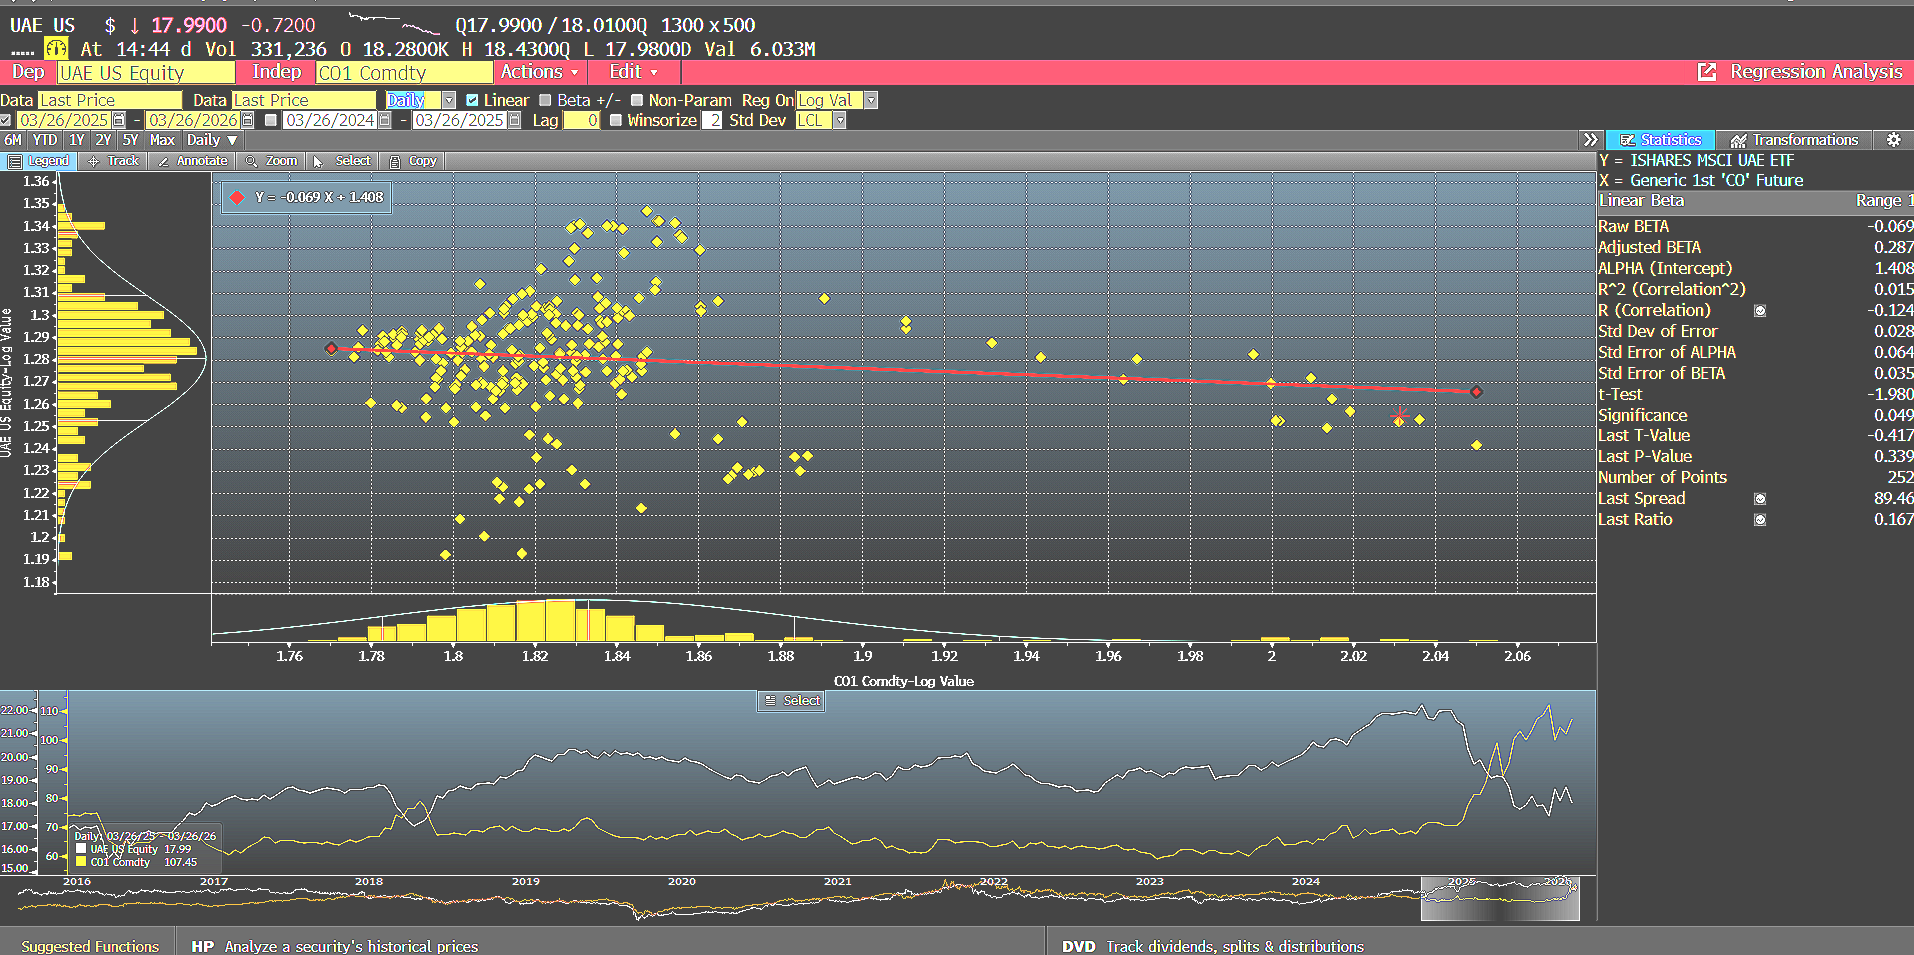
Source for TTM Historical Regression Analysis (Log Value) for UAE ETF and Brent Crude Oil: Bloomberg Terminal as o 3/26/2026
An examination over a longer time horizon however indicates UAE has had a slighlty stronger relationship with oil— with a correlation of 0.41 and an explanatory factor (R^2) of 0.17.
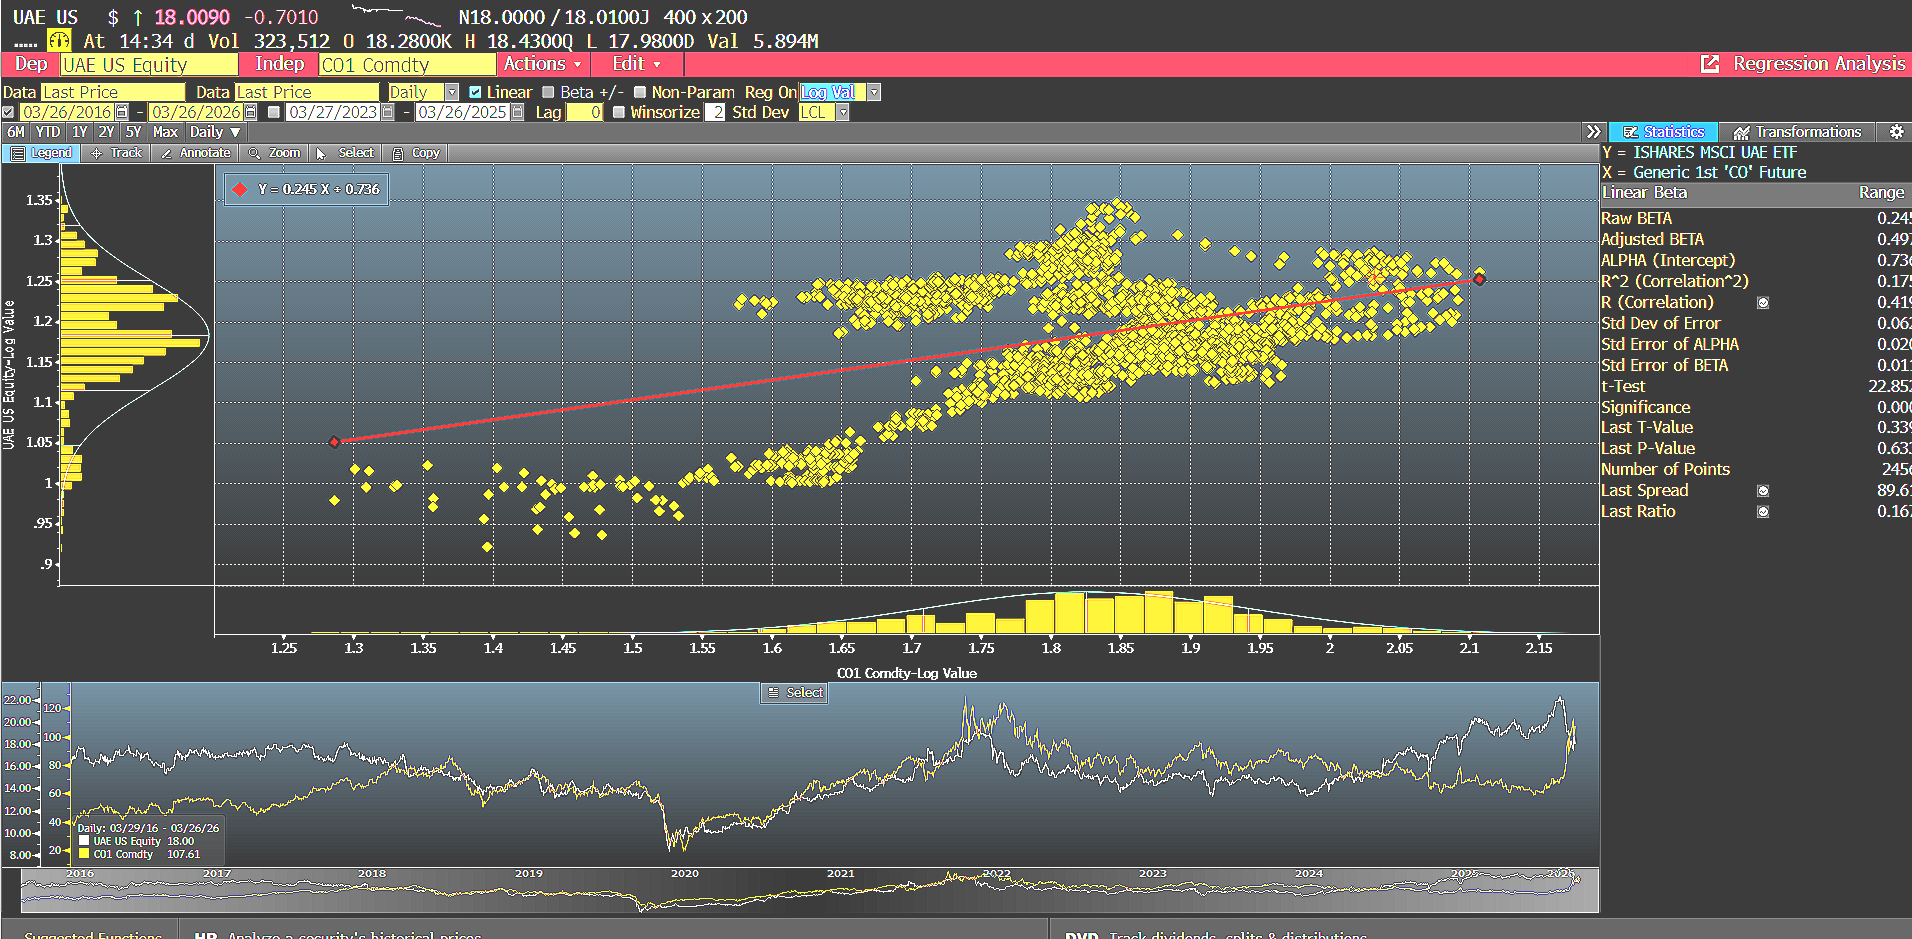
Source or Trailing 10 Yr Historical Regrssion Analysis (Log Value) for UAE ETF and Brent Crude Oil: Bloomberg Terminal as o 3/26/2026
Given the 4-6 sigma move across the commodity complex, institutional investors may be seeking ways to play convexity on this trend of higher oil for longer—espeically in a “toll booth revenue” pipelin and logistics format within MSCI ACWI-exUSA. MSCI Saudi Arabia Index constituents may in fact offer that exposure.
Brent Crude Oil is a much stronger explanatory factor for the log value performance of KSA ETF with a correlation of 0.78, an R^2 at 0.61, and P-Value of 0.10:
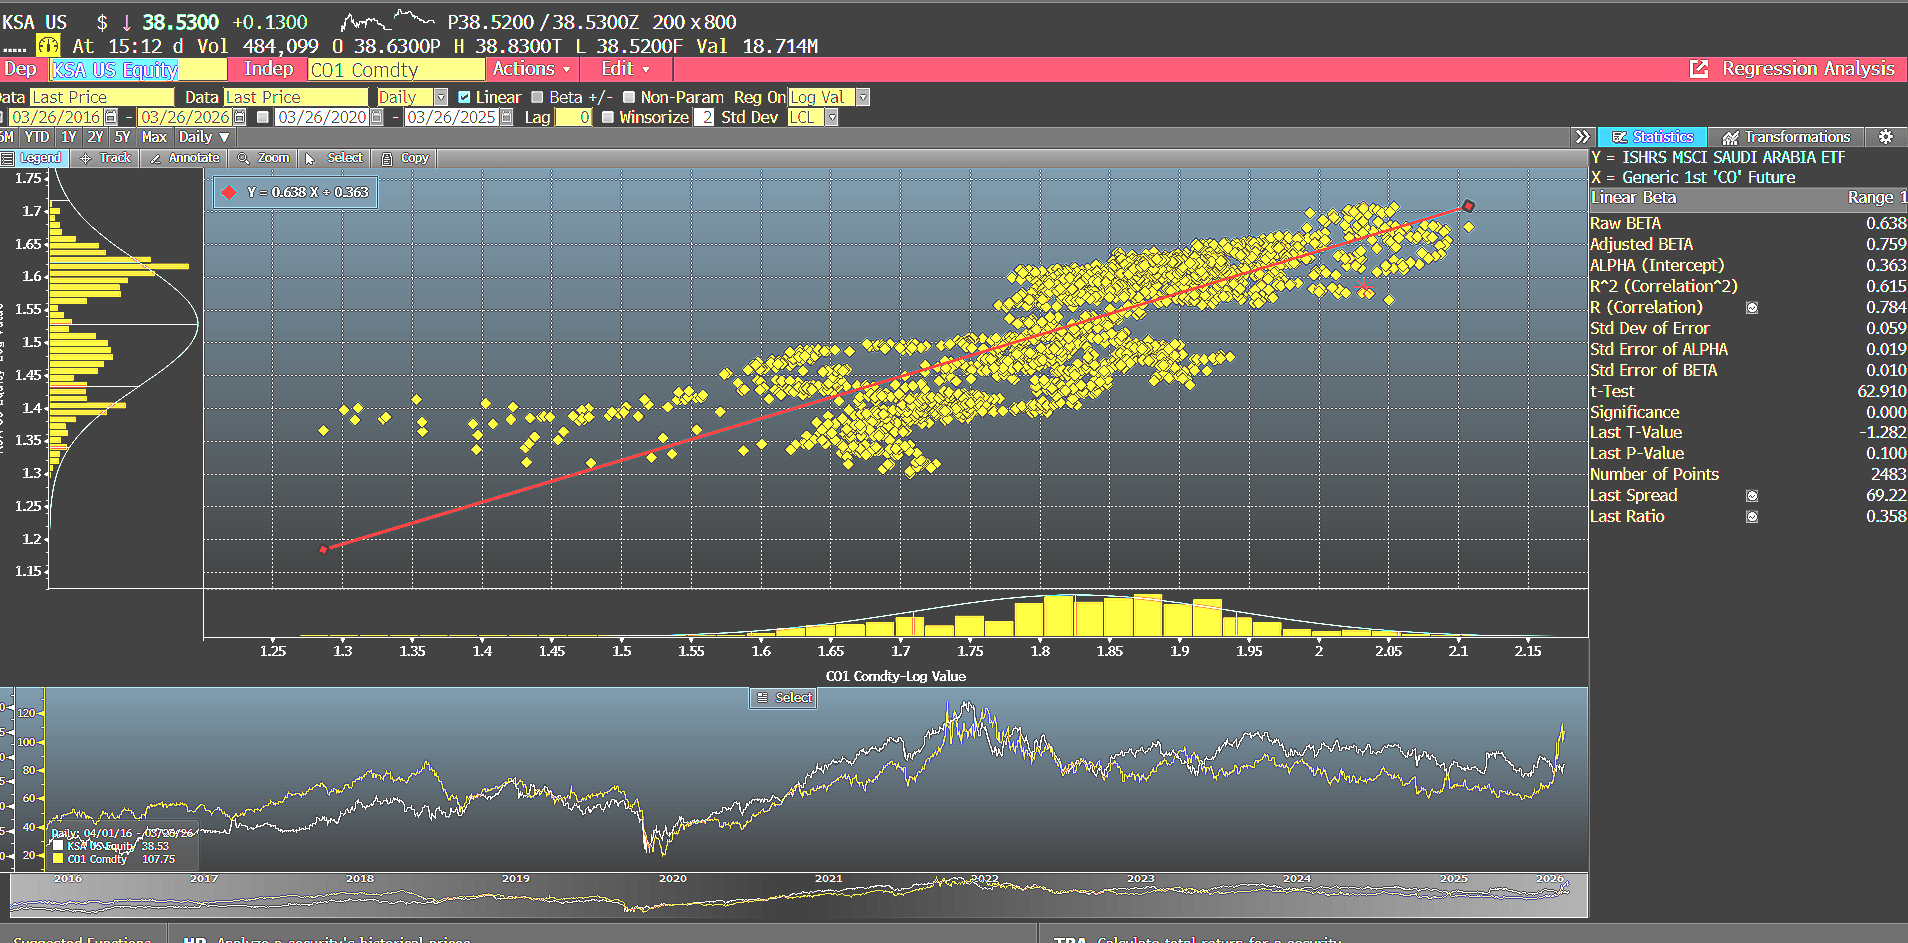
Source or Trailing 10 Yr Historical Regrssion Analysis (Log Value) for KSA ETF and Brent Crude Oil: Bloomberg Terminal as o 3/26/2026
Tracking Error Month to Date (March 2026)-- KSA ETF & UAE ETF, Mind the Gap!
On a NAV basis, KSA ETF has delivered a relatively low tracking error vs the MSCI index all things considered such as an unprecedented war where hundreds of IRGC Missiles and drones have been sent the way of the Kingdom. Tracking Error this month is only 9bp.
Additionally, as projected in the original 2 March 2026 note on "Institutional Investors may use EIS/KSA for ETF Barbell Strategies to Gain Optionality in the Event of Mideast Crash Out Concerns"-- KSA has delivered a much stronger absolute and risk adjusted performance vs MSCI ACWI-exUSA, as measured using the iShares MSCI ACWI-XUS ETF (ACWX). KSA ETF outperformed ACWX-USA by over 12% on an absolute basis since the war started.
KSA ETF Has Delivered a Tracking Error of less than 10bp Since the Start of the War— A Surprising Upside for Institutional Investors’ Beta Managment Allocations to this Important GCC State
Source for total return NAV tracking error of KSA ETF vs its index MSCI Saudi Arabia 25/50 IMI Index and iShares MSCI ACWI-exUSA ETF (ACWX): Bloomberg Termainl as of 3/25/2026
This means MSCI Saudi Arabia Index exposure has been upweighted within MSCI ACWI-exUSA since the war started. Implications: strategic allocators are indeed applying KSA ETF and other index solutions such as broker-dealer custom baskets as part of a barbell strategy to weather the Mideast “Crash Out” risk storm.
Note: Keep in mind, BlackRock Fund Advisors may engage in Fair Value Accounting when the underlying market lacks liquidity due to closure for unforeseen events such as war, or trades on days not conventional in the USA for example. This is exactly what happened with the UAE ETF and a driver for its divergence in tracking error compared to KSA ETF.
Due to over 2,000 drones and missiles that targeted the Emirates in the first days of the war, the UAE ETF became a primary source for hedgers seeking to reduce exposure to asymmetric downside of major infrastructure damage-- and the eventually re-leveraging of the economy to rebuild. Due to these acts of IRGC violence against the peaceful Emirati Kingdom, the underlying stocks could not trade the first couple days of the war given the closure of the Dubai Stock Exchange. Interestingly the tracking error of UAE ETF vs. its MSCI Index is 2.47%-- much greater than what the daily annualized expense ratio drag would cause and historic norm:
UAE ETF Has Delivered a Tracking Error of 247bp Since the Start of the USA-IRGC War: Much Higher Annualized Rate than Historical Trend
Source for total return NAV tracking error of UAE ETF vs its index, MSCI All UAE Capped Index: Bloomberg Termainl as of 3/25/2026
This indicates sampling and transaction costs may be a driver for this month's tracking error spike-- understandable given the war is going on. Recall in the original piece, DuLac Capital Advisory L.L.C. projected that although EIS/KSA would be used as the primary ends of the institutional investor barbell (in a delta neutral format via options overlay strategies), that they may engage UAE ETF and iShares MSCI Turkey (TUR) ETF for greater dispersion plays. This is exactly what has happened this month.
Keep in mind that DuLac Capital Advisory L.L.C. previously projected that the USA would reconstitute a form of "Brady Bonds" for the GCC states that experienced unprecedented attacks by the IRGC; this will be done to limit financial contagion which will be good in the end for many American 401K index investors that hold both equity and sovereign bonds of GCC states.
Summary— Country ETFs for Price Discovery & Rapid Beta Management During Vol of Vol Uncertainty Spikes
This means index fund managers had to engage in Fair Value Accounting of the underlying stocks to ensure the liquidity of the UAE ETF remained intact. Seasoned traders may remember this happening with Van Eck's Greece ETF (GREK) during its financial crisis peak in May 2010. These events in the ETF landscape are rare, yet the optimistic perspective is that they show ETFs tend to be a sound "technology" that enables professional investors to gain rapid beta exposure during volatility regime shifts to broad and even narrow sectors and risk factors of the market. There are always two sides of every trade— and at least liquid ETFs enable price discovery and rapid beta management or institutional investors seeking to hedge possible index up/downweightings due to volatility regime shifts: vital for tail risk hedging during geopolitical risk premium expansions.
31 March 2026— Month-End Performance Review: KSA+EIS Delta Neutral Barbell Delivered 13%+ Absolute & Strong Risk Adjusted Results vs MSCI EM Asia Index (EEMA ETF as Proxy)
According to Bloomberg PORT, a portfolio of 70% KSA ETF and 30% EIS ETF— which is reflective of their generic Feb 2026 month end market cap contributions to MSCI ACWI ex-USA Index— generated 13.47% excess return vs iShares EM Asia ETF (EEMA). On 8 March 2026, DuLac Capital Advisory L.L.C. projected institutional asset managers and asset owners would indeed overweight the pair (MSCI Israel and MSCI Saudi Arabia via ETFs for interim beta) relative to constituents (EEMA ETF).

Why? Pension Fund CIOs and Hedge Fund PMs sought to gain optionality with their EEMA positions given their historically negative beta to Brent Crude Oil. EEMA ETF has recorded over $570MM in net outflows over the past month.
Source: Bloomberg Terminal as off 3/31/2026
MSCI Saudi Arabia as Represented by Interim Beta Instrument, iShares MSCI Saudi Arabia ETF (KSA) Delivered Over 16% off Outperformance vs EEMA ETF, before Credit Collar Option Overlay Strategies Are Even Accounted for—

Total NAV Return of KSA ETF, EIS ETF, EEMA ETF and ACWX ETF Source: Bloomberg Terminal as of 3/31/2026
Operational Risk Management Next Steps to Consider:
Optionality via ACWX overlay Strategies and EEMA Security Lending
EEMA’s IV is actually lower than ACWX’s right now, which is historically rare. This indicates a relative "volatility discount" in Asian emerging markets– which tend to be commodity shock sensitive– compared to the broader global ex-USA basket.
ACWX Observation: The 95% IV Percentile is the "red flag.” It indicates ACWX options have been cheaper than this for 95% of the last year. You are paying a high premium to enter now. However, the current price is down ~11% from its February high, suggesting the market is already pricing in a "downside skew."
EEMA Observation: EEMA’s IV is actually lower than ACWX’s right now, which is historically unusual. This suggests a relative "volatility discount" in Asian emerging markets compared to the broader international basket. For structurally net long institutional investors seeking to hedge the rising beta with their MSCI ACWI-exUSA exposure, shorting $1B AUM EEMA ETF may be as optimal as stitching together a basket of single name securities in the commodity shock sensitive index…..
Please reach out for the rest of this Thought Piece. DuLac Capital Advisory L.L.C. specializes in tech-enabled investment due diligence and portfolio efficiency consulting for institutions. If there's interest in deeper validation, scenario modeling, or bespoke product due diligence on related ETF/index strategies (e.g., stress-testing barbell allocations under prolonged energy disruptions), we’ll be happy to facilitate an introductory discussion with their team to explore potential collaboration.
For the rest of this update (including tracking error signal intelligence) “Institutional Due Diligence Signals: Deciphering Mideast ETF Creation/Redemption Case Studies Amidst Hormuz Strait Volatility” contact ryanscott@dulaccapitaladvisory.com
DuLac Capital Advisory L.L.C. specializes in tech-enabled investment due diligence and portfolio efficiency consulting for institutions. If there's interest in deeper validation, scenario modeling, or bespoke product due diligence on related ETF/index strategies (e.g., stress-testing barbell allocations under prolonged energy disruptions), we’ll be happy to facilitate an introductory discussion with their team to explore potential collaboration.
DuLac Capital Advisory’s ETF/Beta Solutions Risk Due Diligence App : https://www.dulaccapitaladvisory.com/services
(sample version for institutional investors only)
Contact
DuLac Capital Advisory—Independent index solutions due diligence for asymmetric event risk.
ryanScott@dulaccapitaladvisory.com | +1‑516‑838‑6833
**Investment News, Market Insight, and Investment Insight Disclaimer**
The information, investment news, and policy insights provided by DuLac Capital Advisory L.L.C. ("the Firm") through its publications, reports, newsletters, and communications, including but not limited to Investment News, Market Insight, and Investment Insight, are intended for informational and educational purposes only. These materials are not to be construed as specific investment recommendations or advice. DuLac Capital Advisory L.L.C. is a technical services management consultant for companies and institutional investors. DuLac Capital Advisory L.L.C. does not receive any revenue from any company or service mentioned in this insight piece.
**Not Investment Advice:**
The materials provided by the Firm do not constitute investment advice or recommendations to buy, sell, or hold any securities or investment products. The insights offered are general in nature and do not take into account the individual circumstances, investment objectives, risk tolerance, or financial situation of any particular institutional investor or recipient.
**No Reliance:**
Institutional investors should not rely solely on the information provided by the Firm for making investment decisions. It is recommended that investors conduct their own due diligence, seek advice from qualified financial professionals, and carefully consider their investment objectives and risk appetite before making any investment decisions.
**No Guarantee:**
While the Firm strives to provide accurate and up-to-date information, there is no guarantee of the accuracy, completeness, or reliability of the information provided. The financial markets and economic conditions are subject to change, and the information provided may become outdated or irrelevant over time.
**Risk Disclosure:**
Investing in financial markets involves inherent risks, and the value of investments may go up or down. Past performance is not indicative of future results. Institutional investors should be aware of the potential risks associated with investment decisions and should consult with professionals who are qualified to provide personalized investment advice.
**No Endorsement:**
Any mention of specific securities, investment products, or companies does not constitute an endorsement, recommendation, or promotion of those securities, products, or companies by the Firm. The inclusion of any such information is for informational purposes only. No compensation was received from including any investment product or technology into the White Paper.
**Legal and Regulatory Considerations:**
Institutional investors are responsible for understanding and complying with all applicable laws, regulations, and guidelines related to their investment activities. The Firm's materials are not intended to replace or substitute for legal or regulatory advice.
The Firm disclaims any liability for the use or interpretation of the information provided in its materials. Institutional investors should use their judgment and exercise caution when relying on any information provided by the Firm.
For personalized investment advice tailored to your individual circumstances, we strongly recommend consulting with licensed financial advisor at a major Wealth Manager.