

Institutional Investors May Go Long MSCI China (MCHI ETF), and Short MSCI India (INDA ETF) if War Escalates post 7 April 2026
Bottom Line Up Front:
“Luck is the Residue of Design”: In 1Q 2024, DuLac Capital Advisory L.L.C. published a note that warned institutional investors should go long U.S. tech and fossil fuel energy levered to the AI tech build out boom, while going underweight MSCI China Index–
US Tech Over Mainland China Tech in 2024-2026: Especially tech constituents (CQQ)– relative to less “stakeholder capitalist” oriented, MSCI Taiwan (EWT ETF) and American Tech/Communication services (IGM ETF): Crouching DEIger, Hidden ESG Dragon: Is Collectivist Stakeholder Capitalism the Next Enron or Growth Engine?
U.S. Tech Outperformed–Results: The trade worked out quite well over the ensuing two years, with MSCI China Index (All Shares; one can use iShares MSCI China ETF, MCHI, as a proxy) underperforming U.S. Tech/Communication Services on an absolute and risk-adjusted basis.
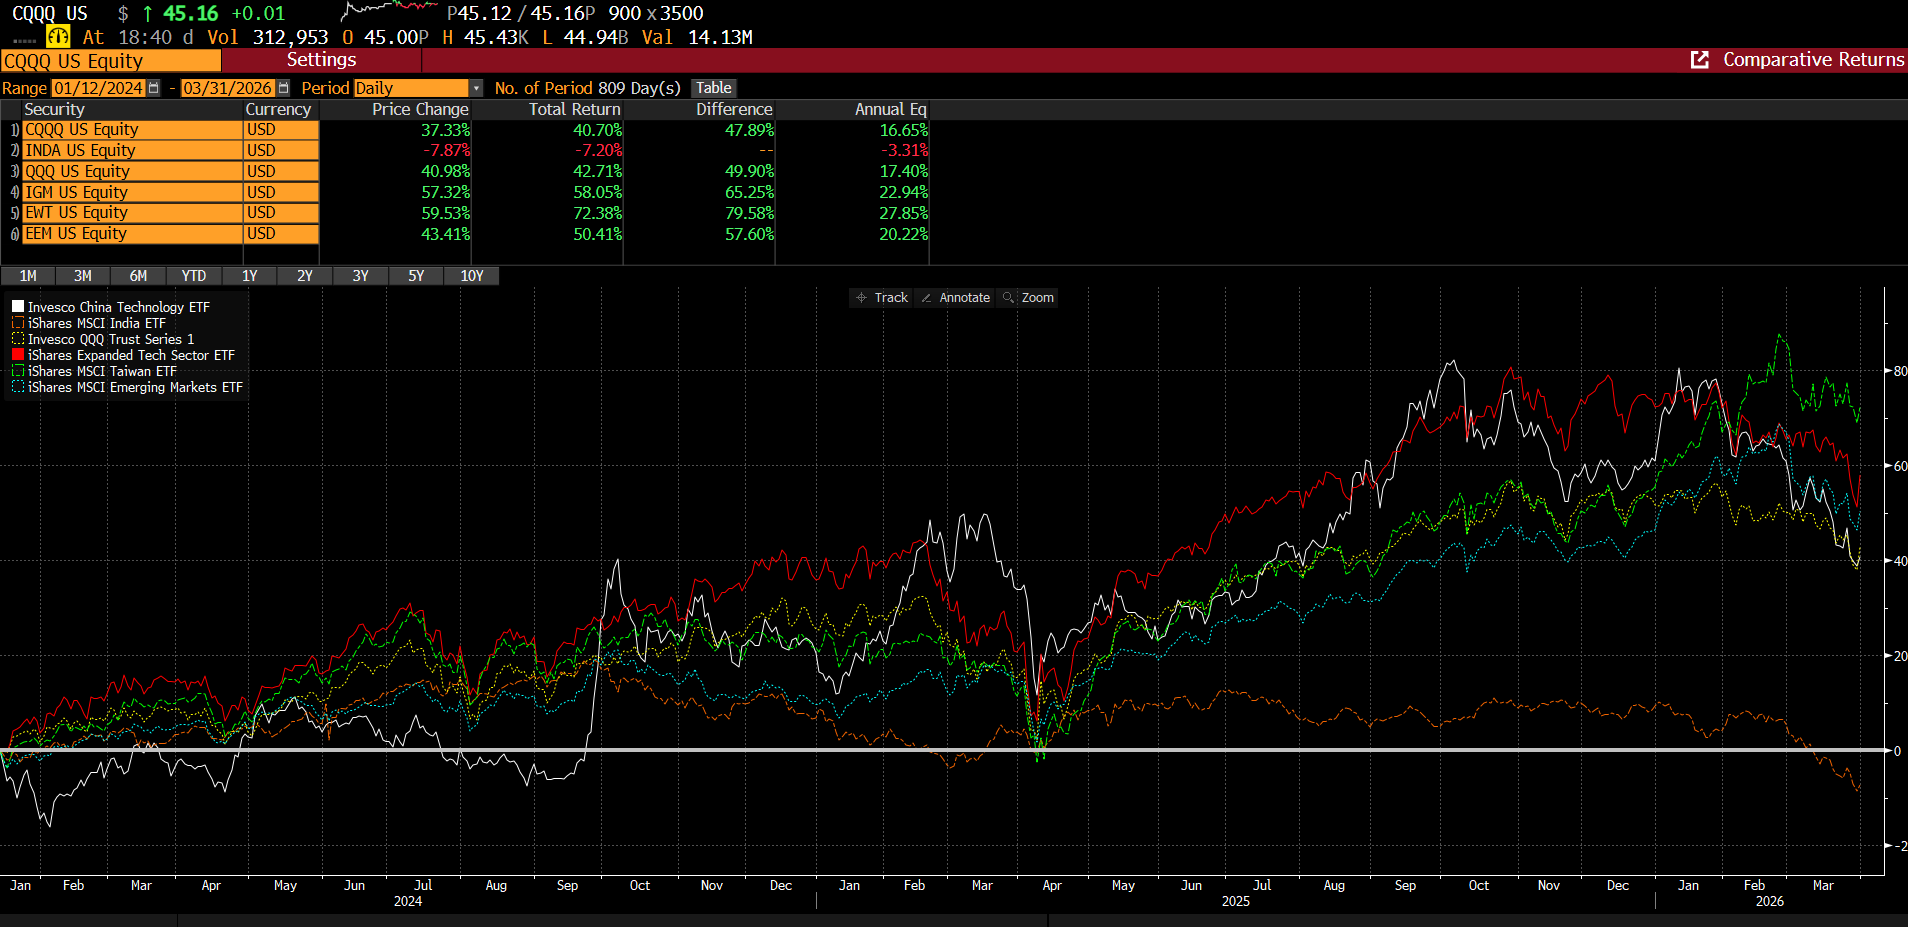
US Tech (QQQ ETF, IGM ETF) Outperformed Mainland China Tech (CQQQ) between 2024-2026. Source: Bloomberg Terminal as of 04/06/2026
Red Cell Testing of Assumptions: Investing though requires rigorous “Red Cell” stress testing of the thesis as the market regime eventually shifts. Given the Hormuz blockade by the IRGC, creating a ‘toll booth’ for up to 1/3rd of the world’s seaborne oil according to Morgan Stanley Commodity Research Team– and previously stated by think tank, Middle East Forum– we are now at such a regime shift.
Value with Catalyst for Low Multiple Trading East Asia Cohort: DuLac Capital Advisory L.L.C. projects institutional capital allocators will now start hunting for “value with catalyst” trade themes– ones that combine potential positive beta for a commodity market that is higher for longer, while also pairing that with country exposure that is levered to the AI growth trend. But with a key caveat:
PRC GW Power Capacity Strength: Countries that have grown their GW Capacity with an “all the above” solution set, such as the People’s Republic of China over the last couple of years as the overweight. The PRC has over 3,890 GW of power capacity— much of that developed in the last few years due to its investment in wind/solar.
While country exposures that still struggle with power capacity sovereignty, such as MSCI India, as the main underweights.
Relative Investing for ACWI ex-USA Investors: As opined on 8 March 2026, we are now in a relative game, this year– so investors are right to engage in delta neutral barbell long/short trade ideas for their MSCI Global ACWI ex-USA allocations.
Going long a combination of MSCI Saudi Arabia IMI (capped) along with MSCI China (all shares), and short MSCI India, while moving out of the underweight on MSCI East Asia, may reduce the risk of upside surprise with MSCI EM Asia (EEMA ETF) cyclical constituents such as Korea and Taiwan may generate.
Luck is a Residue of Design– Not Index Hugging:
In Chief David Goggins seminal autobiography, You Can’t Hurt Me, the retired Navy SEAL– who also underwent Army Ranger School Survival training– discusses the moment that catalyzed his life from a pest controller, to being renowned as one of the toughest men on the planet. It was a long night of spraying for bugs at an Indiana Steak ‘n Shake. Future SEAL, Goggins, came home one early morning looking forward to his routine of a box of donuts and a Steak ‘n Shake double. After getting out of the shower, it was serendipitous fortune that his TV was turned to the Discovery Channel where they were showing a documentary of a NAVY SEAL BUD/s training from class 234 circa 1999/2000– one of the last classes to enter before 9/11.
This dramatic documentary captures the passion, pursuit of excellence, and perfection required to make it to one of America’s most elite special operator forces. In the show, the viewer is treated to a mantra from the Drill Instructors reminding the cohort of recruits who always seem to be struggling with the “evolutions” that: “luck is the residue of design.” It was upon seeing this documentary, that the 300 pound bug sprayer, David Goggins, decided to start designing his own luck in life for the better.
Following the dramatic rescue of the downed pilot by SEAL Team Six and other special operators this past weekend, one can see the meticulous detail that America’s forces train for success. In BUD/s training, the recruits have to test themselves at mock ups of every past catastrophic– “six sigma” event risk– in special forces history: from D-Day to Operation Red Wings. There is no room for mere “index hugging” performance misconstrued as luck– operators are trained to stress test their alpha generation.
Portfolio Managers certainly do not face life or death situations when they implement their investment thesis. Nonetheless, the stakes are high as people’s pensions and 401Ks are often hanging in the balance; many special forces end up in local/state police departments upon military retirement and the last thing a PM would want to do is not identify a beta regime shift that causes such heroes to prolong their retirement in order to “save more for the golden day.” Institutional Investors would be wise to do the same at their level: volatility regime shifts– as witnessed this March 2026– cause dispersion among betas that must be rapidly captured, so that the PM team can focus their time finding the best of breed alpha generation risk drivers.
According to a report from Goldman Sachs Prime Brokerage published on Fidelity on 1 April 2026, March 2026 was the worst month on average for Hedge Funds since the Russia-Ukraine war breakout in 2022 where both bonds and stocks largely sold off hard as investors faced the twin challenges of global growth slowdown yet potential runaway commodity driven headline inflation. DuLac Capital Advisory L.L.C. specializes in “Red Cell” testing of portfolios– a concept borrowed from the founder of SEAL Team Six/DEVGRU, Commander Richard Marcinko.
According to Commander Marcinko’s autobiography,Rogue Warrior, he was tasked by the head of Navy SPECWAR to form a new elite unit that would ensure Americans would never again have a Operation Eagle Claw failure when trying to rescue compatriots behind enemy lines (as what happened with President Carter’s doomed mission to finally try to rescue USA embassy hostages in the nascent IRGC controlled Tehran).
In Vietnam, according to his interview for the book, Hunters and Shooters: an Oral History of Navy SEALs in Vietnam, Senior Chief Marcinko (at that time), was known for forcing his NAVY SEAL teammates to wear the Vietcong black “pajamas” and going on stakeouts deep behind enemy lines barefoot to confuse the enemy and even conventional American soldiers. Commander Marcinko wrote how he would often recruit commandos who were not known as the best athletes in BUD/s, but rather ones that often would finish in the 3rd quartile– exchanging the lack of natural athletic ability for true grit. His team would test military readiness by pretending to be the enemy, and “stress testing” their resilience to shocks.
Ahead of President Trump’s latest deadline (Wednesday 8 April 2028 at Midnight GMT– as Asian listed ETFs are already trading then), for the IRGC to end its blockade of Hormuz Strait, let’s stress test the thesis that Institutional Investors may now shift their long on KSA/EIS and short on broad MSCI Asia EM (EEMA) that generated 13% excess returns in March 2026, by instead pivoting to the far east.
2. The Pivot Ahead of President Trump’s Showdown: KSA/MCHI vs INDA ETF/MSCI India Total Return Swaps
DuLac Capital Advisory L.L.C. has identified a few key ETF/Index product signals that global ACWI ex-USA benchmarked investors are constructing a “silk road meets the Yanbu port” EM Barbell: MSCI China (MCHI ETF) with MSCI Saudi Arabia (KSA ETF), with a delta hedge by shorting commodity starved India: iShares MSCI India ETF (INDA), or iShares India 50 ETF (INDY ETF).
Multiple Discount to Peers: MCHI has experienced a multiple to earnings contraction over the last five years as institutional investors have come to rightfully fear the State’s history of private capital confiscation, such as what occurred with Alibaba’s (FXI ETF, MCHI ETF) quantum computer a few years ago. However, with a ~20% P/E discount vs MSCI ACWI ex-USA ( 18.37 P/E for ACWX ETF vs 14.6 P/E for MCHI ETF per Bloomberg Terminal as of 4/2/2026)-- and even greater discount relative to INDA ETF (22.6 per Bloomberg Terminal as of 4/2/2026), investors may prefer the earnings yield cushion for MSCI China over MSCI India or NIFTY 50.
MCHI ETF Trades at over a 20% P/E Multiple Discount to INDA ETF (MSCI India) per Bloomberg PORT Analysis
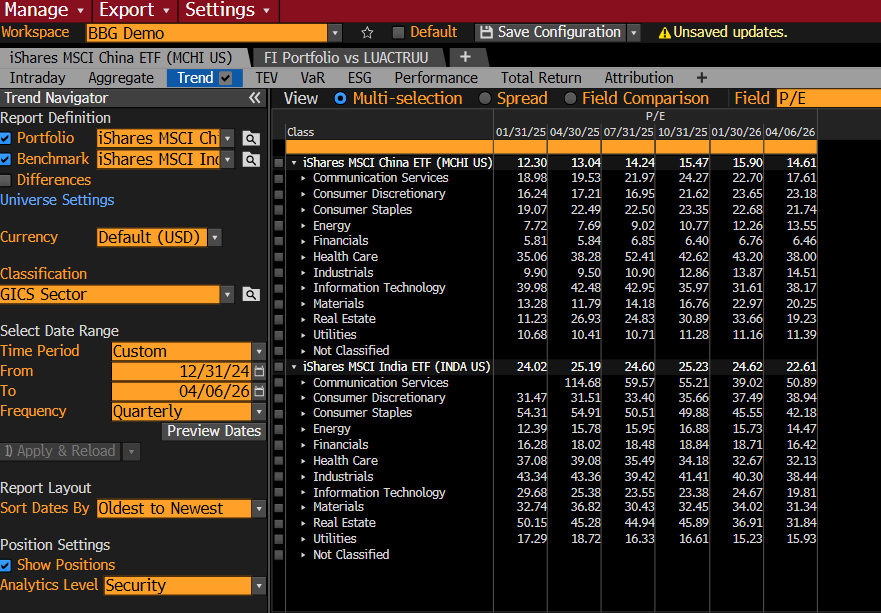
Source: Bloomberg Terminal PORT Function as of 04/06/2026
What MCHI ETF Gives up on Size Factor Relative to INDA ETF, it Gains in 30D Idiosyncratic Return and Growth Factors
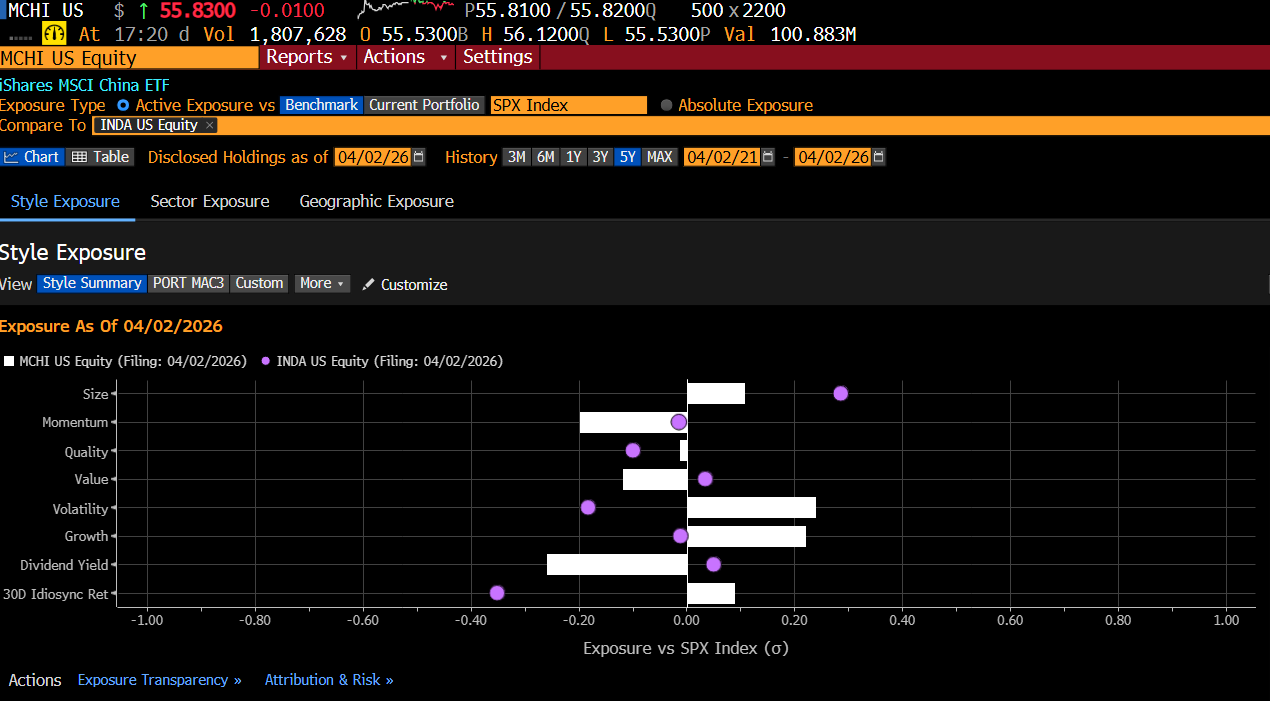
Factor Tilts Analysis show MCHI ETF to have much more significant Idiosyncratic Return than INDA ETF. from Bloomberg Terminal as of 04/06/2026
3. Institutional Investors may identify MSCI China as being “cheaper to keep her” relative to MSCI India–
especially considering there still is still an underpriced risk of a broad earnings revision to MSCI ACWI ex-USA commodity sensitive country constituents due to the Hormuz oil/gas/fertilizer/helium Blockade.Lower multiples relative to ACWX and MSCI India/India Nifty 50 could signal a relative allocation catalyst for institutional investors seeking a margin of safety for their portfolio utility function modeling (a function of expected Sharpe Ratios and correlation of the potential asset vs. a performance benchmark).
MCHI ETF is trading at the cheapest quartile relative to INDA ETF over the last 14 years:
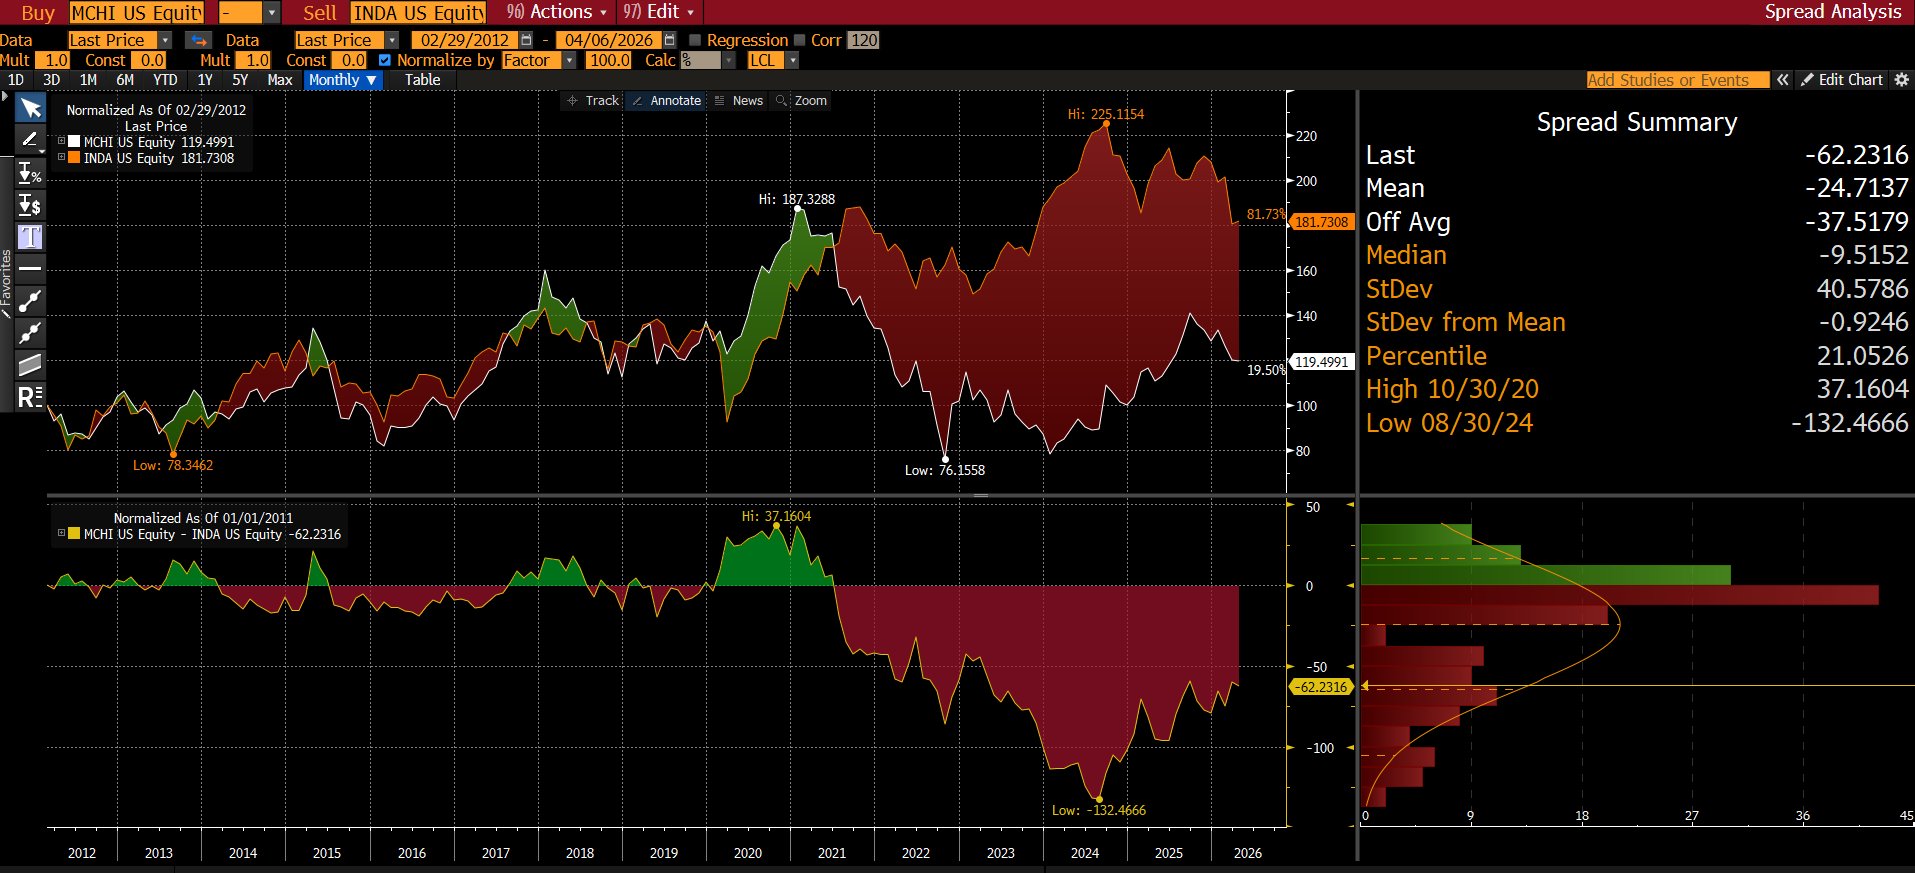
INDA ETF vs MCHI ETF, returns compared against another, normalized to 100 starting 02/29/2012 (common inception). Source: Bloomberg Terminal as of 04/06/2026
Volatility Profile of MCHI ETF and INDY ETF Have Converged Since War’s Inception—
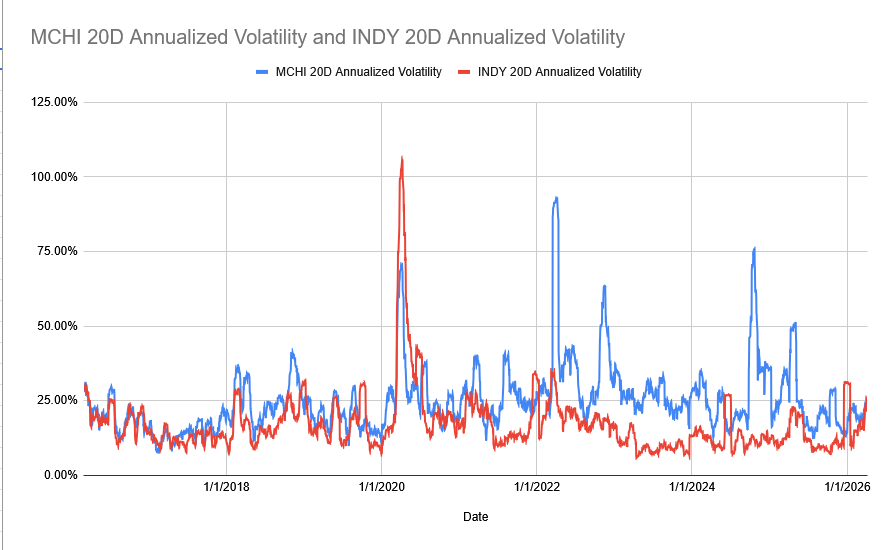
Given the volatility convergence and 20% cheaper P/E Multiple, Capital Allocators may find MSCI China Index constituents to have a more optimal portfolio utility than MSCI India (INDA ETF) or India Nifty 50 (INDY ETF). Source: Google Gemini Finance as of 04/06/2026
4. MCHI ETF Short Interest ratio and Volatility Profile vs History– Declined since War Start:
MCHI ETF Short Interest peaked at the start of the war, touching 2.5% of shares outstanding. However, throughout March 2026, institutional investors unwound their shorts on MCHI ETF, likely opting for other hedging instruments instead, and perhaps seeing room for upside surprise in the event the IRGC inks a ‘toll’ deal with the PRC.
Short Interest Ratio has Declined from 2.5% to ~ 1.6% since USA-IRGC War Inception
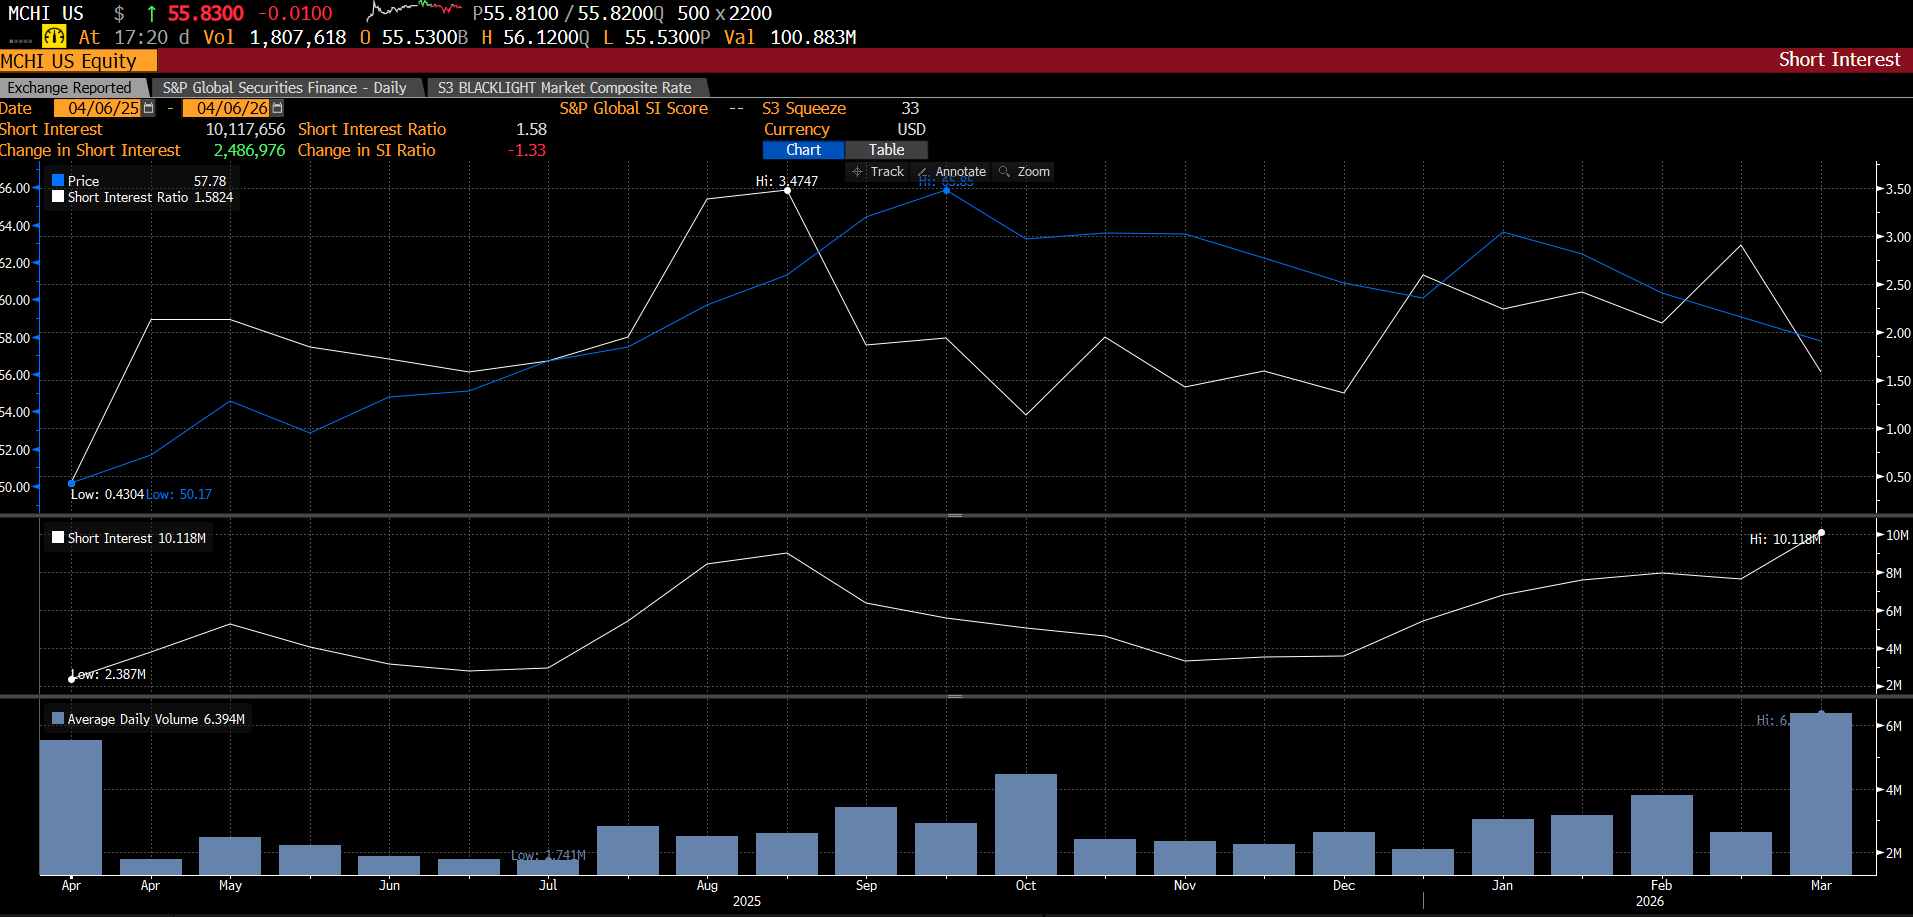
Short Interest Ratio Graph for MCHI ETF, Source: Bloomberg Terminal as of 04/06/2026
Implied Vol and Historic Vol Profiles Relative to History Favors MCHI ETF over INDA ETF for ACWX Allocators
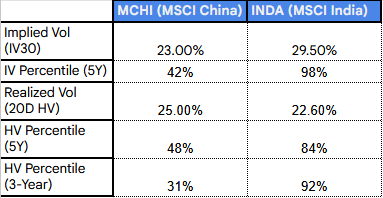
Source: Google Gemini, Nasdaq.com as of 04/06/2026
Volatility Regime Shift between MCHI vs INDA: The volatility profile for MSCI India over the last three years has been lower than MSCI China, as investors allocated to India dedicated funds given its steady-growth regime. However, this current spike to the 90th+ percentile signals a fundamental regime break in beta allocation vs MSCI China (MCHI ETF)— likely driven by the the relative differences between the "commodity starvation factor” of the two significant EM economies since the USA-IRGC war’s inception. MCHI ETF is currently at the 31st percentile of its 3-year volatility history.
Will Institutional Investors Find More RelVal with MSCI China vs MSCI India Given the Power Capacity Difference? This indicates that the "panic" of the Hormuz blockade may cause capital allocators to err on the side of Mainland China for their MSCI EM Asia exposure relative to MSCI India or Nifty 50. Thus, DuLac Capital Advisory L.L.C. projects MSCI ACWI ex-USA benchmarked investors will effectively short a volatility regime that is "breaking high" (MSCI India: INDA ETF) and go long a regime that is "mean-reverting low" (MSCI China: MCHI ETF)
5. Summary—Recognize Beta Shifts to Design your Own Luck with MSCI EM Asia Index Components
These three charts could be pointing to the steam of de-risking leverage associated with the People’s Republic of China may be coming to an end– especially relative to MSCI India. Multiple discount despite similar beta profiles, relative value spread ratios at the cheapest quartile, and a decline in Short Interest since the start of the war could be second order signs that MSCI China is catching a bid. According to Middle East Forum, escalation seems to be the most likely option. Therefore, per CSIS analysis, the PRC’s 1.1 Billion in Crude Oil inventory may be viewed as a buffer in the event of worse case scenarios in the coming week. MSCI China Index constituents may in fact experience less negative beta vs Brent Crude oil compared to MSCI India Index constituents in this time of unknown unknowns.
Update—(13 April 2026): War Escalation is Here: How Institutional Investors Are Implementing the RelVal Trade of Long MSCI China All Shares MCHI ETF (or Dealer Baskets) and Short INDA ETF (or Total Return Index Swaps)
Bottom Line Up Front—
The core equity long MCHI / short INDA thesis (detailed in our 7 April 2026 note) captures relative “value with catalyst” in a higher-for-longer commodity regime driven by PRC power-capacity sovereignty versus India’s constraints– all while capturing Mainland China’s beaten down tech infrastructure play, banking on multiple convergence with MSCI India over the medium term.
To neutralize directional beta while preserving convexity on beta dispersion, institutional capital allocators have been overlaying a delta-neutral options long/short strategy using listed MCHI ETF and INDA ETF options. This structure limits path-dependency driven by uncertainty of war, monetizes implied-volatility skew during escalation headlines, and maintains the relative outperformance view without net market delta—ideal for ACWI ex-USA mandates that must remain structurally invested in the $11.7 Trillion market cap EM sleeve in some fashion.
Source: Gloogle Gemini Finance and Nasdaq as of 04/13/2026
Market Context & Rationale— Why ACWX Institutional Investors Have Gone Long MSCI China, Short MSCI India
Last Monday, 6 April 2026, Dulac Capital Advisory L.L.C. published this note explaining how Institutional EM/ACWI ex-USA benchmarked investors were utilizing index solutions such as ETFs (MCHI, INDA, EPI, KWEB), index futures, broker-dealer custom baskets, and index Total Return Swaps (TRS) to enter into relative value trades between MSCI China (all shares) vs MSCI India. The day after the piece was published, PRC authorities created a trading restriction that prevents any non-ETF/index mutual fund holder of 5% or more equities domiciled in the PRC from short term trading activity.
Despite this, Mainland China equities finished nearly on par with MSCI India. Additionally, the following night, on 7 April 2026, a detente appeared to emerge between the USA and IRGC lead Iran with President Trump’s Truth Social Post about a cease-fire. The de-escalation trade ensued and thus delta neutral and volatility management approaches for MSCI EM opportunity/risk management seemed outdated. However, what a difference a weekend makes. As VP Vance called off any deal with the IRGC in Islamabad— and the following Sunday, President Trump announced his own quarantine of the Persian Gulf— which previously cited Middle East Forum recommended on 9 April 2026— by CENTCOM, delta neutral convexity optimization is back in vogue.
As underscored last week, institutional investors have noticed an energy regime tilt that favors mainland China over India in a “higher for longer” commodity complex scenario: Hormuz-related supply shocks reward countries with “all-of-the-above” GW capacity growth (PRC >3,890 GW, heavy recent renewables + thermal additions) while penalizing those still building power sovereignty (India, which has only 520 GW Power per xAI Grok). The equity long MCHI / short INDA pair trade expresses this cleanly in relative terms.
However, pure equity implementation carries residual systematic beta. A delta-neutral options overlay isolates the China-India spread convexity—profiting from the scenario of an accelerated dispersion if commodity-complex escalation widens the total return spread—while capping premium outlay and gamma risk.
Liquidity in both ETF option chains (MCHI and INDA show consistent volume in 30- to 60-day expirations, with meaningful open interest across strikes) now supports institutional sizing without excessive slippage. This mirrors the successful EIS/KSA barbell we outlined in March 2026 for Mideast “crash-out” tails: targeted optionality without abandoning benchmark exposure.
The options pair trade monetizes this MSCI China/MSCI India (or NIFTY 50 Index tracking INDY ETF) skew compression/expansion without requiring outright directional beta. In the March 2026 volatility regime, similar relative-value overlays on single-country ETFs delivered positive carry while equity long/short pairs experienced whipsaw.
Strategy Set Up– How Institutional Investors Have Implemented the Overlays
Core Delta-Neutral MSCI China/MSCI India Pair Trade for Mideast “Crash Out” Optionality
Institutional Investors have paired convexity on the long leg (MCHI) with convexity on the short leg (INDA) sized to net delta ≈ 0:
Long MCHI convexity: They’ve bought OTM call verticals (e.g., 5–10 % OTM strikes, 30–45 DTE) or have gotten long 1×2 call ratio spreads to capture upside acceleration if MSCI China’s relative power resilience drives outperformance vs MSCI India.
Short commodity sensitive MSCI INDA baskets/index convexity (synthetic bearish): Institutional Investors have bought OTM put verticals or long 1×2 put ratio spreads on INDA to profit from accelerated downside if India faces power/inflation headwinds under escalation.
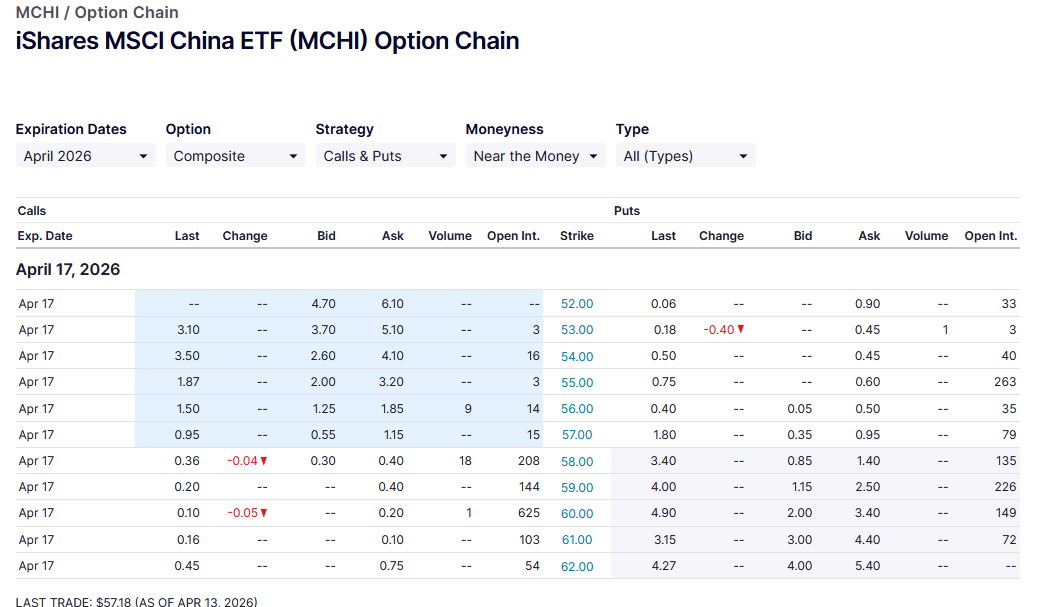
MCHI ETF Options chain for 17 April 2026 Expiry. Source: NASDAQ.com as of 4/13/2026
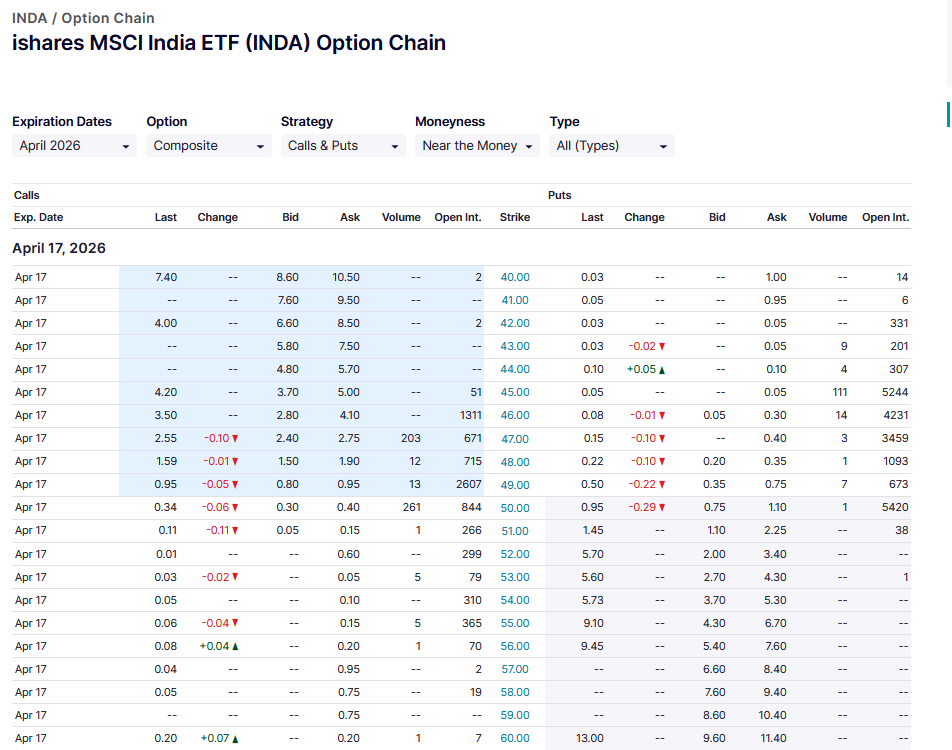
INDA ETF Options chain for 17 April 2026 Expiry. Source: NASDAQ.com as of 4/13/2026
Delta Neutrality Mechanics
Calculate notional based on current deltas and beta of MCHI vs. INDA or NIFTY 50 Index tracking INDY ETF Target net position delta within ±0.05.
Finance premium via short ATM strangles or covered-call overlays on the equity core if desired (hybrid equity + options sleeve).
Alternative “butterfly” variant for defined-risk: Long MCHI call butterfly (body at expected relative breakeven) paired with short INDA put butterfly—pure gamma play on dispersion without directional bias.
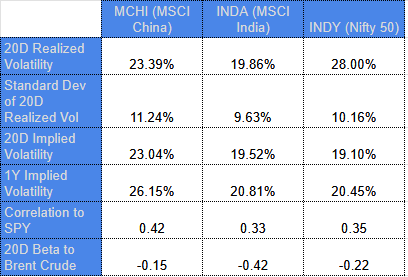
Compared to INDA/INDY ETFs, MCHI ETF has recorded a lower relative negatively beta with Brent Oil since the war broke out:
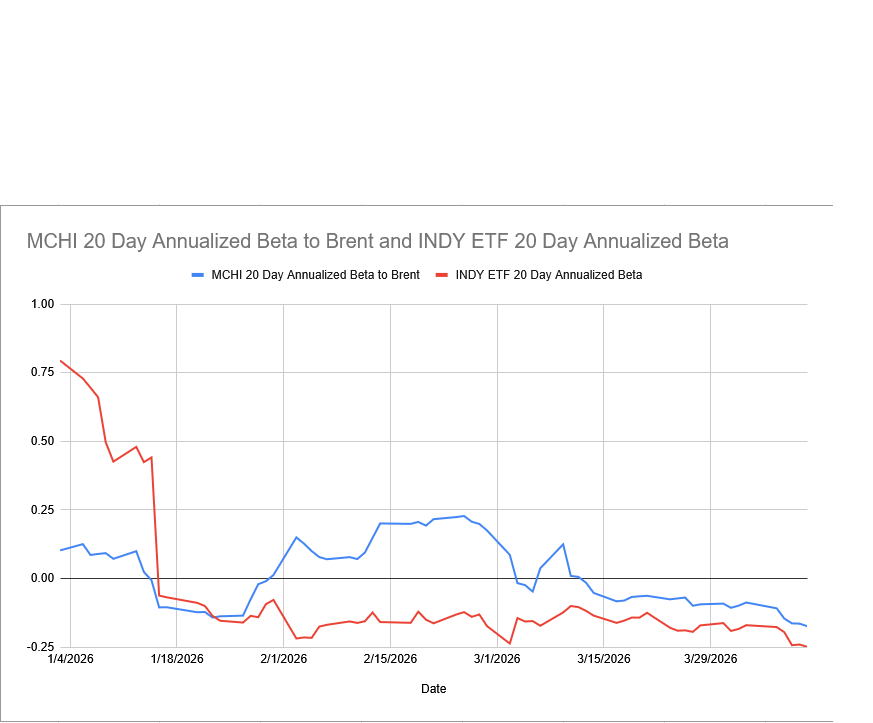
MCHI ETF vs. INDY ETF beta compared to Brent Crude Oil continuous contract. Source: Google Gemini Finance, DuLac Capital Advisory L.L.C. as of 04/10/2026
Both ETFs (and Nifty 50 Index tracking INDY ETF) maintain liquid weekly and monthly chains with IV skew. Currently the skew tends to cheapen OTM puts on India relative to China during risk-off spikes—attractive for the long/short pair trade.
Operational Checklist for Institutional Investors:
Pre-Trade — Confirm options liquidity (volume >200 contracts/day per leg, OI >1,000); review borrow costs if blending with equity short INDA.
Sizing — Limit premium spend to 25–50 bps of sleeve AUM; size for 100 to 200bp of net portfolio volatility contribution.
Governance — Pre-clear rationale with investment committee; document delta-neutral calibration (Bloomberg Terminal Option Analytics or equivalent).
Monitoring— Daily delta/gamma scan; watch creation/redemption flows on MCHI/INDA (iShares and NASDAQ data) and IV term structure (e.g., VIX-like spikes on Asia geopolitics or favoritism in Gulf oil transport by the USA for one EM country vs another).
Exit/Roll Rules — Unwind or roll at 50 % profit target or 21 days to expiration; hard stop if net delta drifts >±0.10 or geopolitical de-escalation confirmed with a deal approved in both Washington, Jerusalem, and Tehran).
Documentation — Tag as “relative-value convexity overlay” for risk/attribution systems.
Execution Considerations/Constraints that Institutional Investors are Considering:
Liquidity & Microstructure: MCHI and INDA/INDY options trade primarily on CBOE with varying width in spreads in front months; avoid low-OI tails. Institutional Investors have used block trades or OTC with broker-dealers for >$5 mm notional, or opted for TRS or custom baskets with their preferred factor/industry exposures.
Vol & Skew Dynamics: Currently favors entry when India put skew steepens (cheapens protective convexity) relative to China call skew.
FX & Tracking: ETFs settle in USD but underlying indices have local-currency exposure; monitor London 4 pm GMT fixing for tracking error. The Republic of India authorities have recently placed bans on foreign investor currency hedging—
iShares MSCI India ETF currently has a 3% allocation to USD cash and other short term maturities likely driven by FX risk concerns— this has contributed to the ETF tracking error vs its benchmark (rooted in positive tracking difference).
Thus, benchmark orthodox investors may be more willing to take on broker-dealer risk via TRS on the MSCI India Index, rather than tracking error risk with the ETF.
Costs: Bid-ask + commissions typically <10 bps round-turn on liquid strikes; theta decay manageable in 30–45 DTE window.
Risks: Correlation and beta breakdown (e.g., if India decouples positively on domestic policy or Trump Admin continuous to grant waivers for it to receive IRGC oil) or IV crush post-de-escalation; mitigate with defined-risk verticals/butterflies….
Contact for full White Paper, Portfolio Scenario Analysis, and Creation/Redemption Signals:
DuLac Capital Advisory—Independent index solutions due diligence for asymmetric event risk.
ryanScott@dulaccapitaladvisory.com | +1‑516‑838‑6833
Investment News, Market Insight, and Investment Insight Disclaimer
The information, investment news, and policy insights provided by DuLac Capital Advisory L.L.C. ("the Firm") through its publications, reports, newsletters, and communications, including but not limited to Investment News, Market Insight, and Investment Insight, are intended for informational and educational purposes only. These materials are not to be construed as specific investment recommendations or advice. DuLac Capital Advisory L.L.C. is a technical services management consultant for companies and institutional investors. DuLac Capital Advisory L.L.C. does not receive any revenue from any company or service mentioned in this insight piece.
Not Investment Advice:
The materials provided by the Firm do not constitute investment advice or recommendations to buy, sell, or hold any securities or investment products. The insights offered are general in nature and do not take into account the individual circumstances, investment objectives, risk tolerance, or financial situation of any particular institutional investor or recipient.
No Reliance:
Institutional investors should not rely solely on the information provided by the Firm for making investment decisions. It is recommended that investors conduct their own due diligence, seek advice from qualified financial professionals, and carefully consider their investment objectives and risk appetite before making any investment decisions.
No Guarantee:
While the Firm strives to provide accurate and up-to-date information, there is no guarantee of the accuracy, completeness, or reliability of the information provided. The financial markets and economic conditions are subject to change, and the information provided may become outdated or irrelevant over time.
Risk Disclosure:
Investing in financial markets involves inherent risks, and the value of investments may go up or down. Past performance is not indicative of future results. Institutional investors should be aware of the potential risks associated with investment decisions and should consult with professionals who are qualified to provide personalized investment advice.
No Endorsement:
Any mention of specific securities, investment products, or companies does not constitute an endorsement, recommendation, or promotion of those securities, products, or companies by the Firm. The inclusion of any such information is for informational purposes only. No compensation was received from including any investment product or technology into the White Paper.
Legal and Regulatory Considerations:
Institutional investors are responsible for understanding and complying with all applicable laws, regulations, and guidelines related to their investment activities. The Firm's materials are not intended to replace or substitute for legal or regulatory advice.
The Firm disclaims any liability for the use or interpretation of the information provided in its materials. Institutional investors should use their judgment and exercise caution when relying on any information provided by the Firm.
For personalized investment advice tailored to your individual circumstances, we strongly recommend consulting with licensed financial advisor at a major Wealth Manager.