

Institutional Fixed Income ETF “Butterfly Barbell” Strategies | TLT, LQD, HYG/ JNK for Mideast “Crash-Out” Risk Optionality (Update Four) – Dulac Capital Advisory
Bottom line Up Front:
US Govie long bond duration risk historically experiences short term beta to commodity price shocks; however, it tends to stabilize in the medium term likely due to demand destruction. This causes institutional investors to hedge their gamma risk and theta risk via beta management solutions such as iShares 20+ Year Treasury ETF (TLT).
Additionally, in the credit markets, spreads in both key CDS indices, tracked by the respectively equal weighted CDX IG Generic 5 Year Index and CDX HY Generic 5 Year Index on Bloomberg are at levels of their long term average. The fact that spreads have barely moved one iota towards 1 sigma, let alone 2 should be wisely compared against the Brent Crude Oil 4 sigma move earlier this March.
This is despite Monday’s (23 March 2026) 14% decline in front month prices: institutional investors are aware that the December curve has recently risen from the low $60s oil per barrel to the $80s. Therefore indicating higher for longer, despite whatever five day window for a deal can provide.
Based on historical betas and R2s to Brent, DuLac Capital Advisory L.L.C. expects this to impact the tightly trading and higher duration IG credit (ex, LQD) over lower duration— and greater fossil fuel energy risk factor exposed HY Credit: iShares iBoxx USD High Yield Corporate Bond ETF (HYG), and State Street SPDR Bloomberg High Yield Bond ETF (JNK).
Thus, astute institutional investors are using this brief market respite to gain optionality— in DV01 delta neutral formats— on long duration convexity and relative credit spread convergence between HY and IG through option overlay strategies on the ETFs and/or on CDX index solutions from S&P IHS Market.
“Butterfly Barbell” strategies are emerging where structurally FI long institutional capital allocators are going long credit carry with more bullish exposure to HY (HYG/JNK), hedged with bearish exposure to hard dollar duration heavy IG credit (LQD). Meanwhile they are anchoring duration risk with credit collars on long bond exposure through TLT.
Executive Summary— DV01 and the Dugout
According to breaking news on the Council of Foreign Relations, President Trump “walked back a threat to target Iranian power plants” this morning (23 March 2026) at 830 AM– Bloomberg reports Brent Crude Oil has tumbled by 14% back down to $102 a barrel. DuLac Capital Advisory L.L.C. thinks we are still in the bottom of the 2nd inning of a major market regime shift across asset classes. Warren Buffett famously wrote in one of his essays that he likes to “Predicting rain doesn't count. Building arks does.” Given this nascent market optimism, multi-asset class allocators and fixed income portfolio managers should use this window to begin earnestly building their arks for an eventual underpriced drawdown risk driven by continued multiple sigma events 2026 in the commodity markets this month due to the USA-Iran war.
In August 2025, BlackRock’s Chief of Global Allocation portfolios, Russ Koesterich, CFA, JD wisely warned in a note on cross-asset class barbell strategies:
“Unlike the previous decade when yields were low U.S. Treasury bonds offered an effective hedge, but this decade fixed income is playing a different role. With inflation still elevated, long duration bonds are no longer a reliable hedge against equity risk”
Given the significant move in the DM world sovereign bond market this March 2026, juxtaposed with a relatively sanguine equity market, what optionality are institutional fixed income investors allocating to now– that, similar to the spring of 2008– are not yet fully recognized by the wider investor audience? Additionally, how are institutional investors using Fixed Income ETFs to barbell tail risks in light of growing long-term Mideast “Crash Out” prospects? This is the fourth piece in DuLac Capital Advisory L.L.C’s series on applying ETFs and other index solutions as part of Barbell Strategies to Gain Optionality due to underpriced Mideast “Crash Out” Risks.
4 Sigma Event Risk Hit Brent Crude Oil in March 2006— yet long duration rates and Credit have been tame, how much longer will this last?
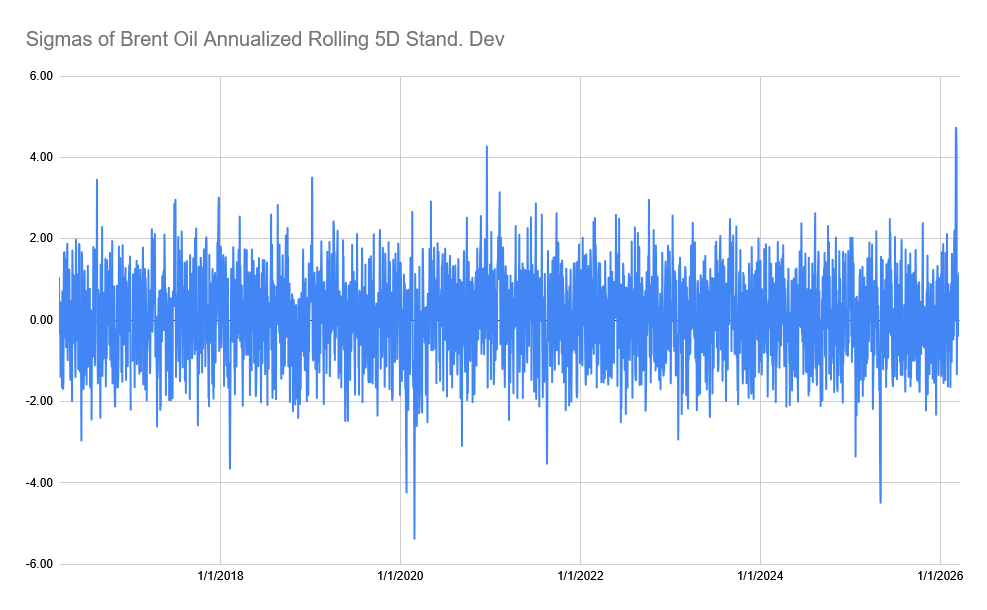
By early March 2006, Brent Crude Oil massive upside change of over 40% amounted to a ~4 sigma event. This type of historic move typically has pass through effects to other markets such as equities, rates, and especially credit (chart below). Source: Bloomberg Terminal for Brent Crude Data, Google Gemini for z-score model as of 3/23/2026.
The Mideast “Crash Out” Tail Risk: Identifying Historical Credit Volatility Breakout— Oil’s 4 Sigma Event Risk Likely Not Yet Priced in High Yield Spreads as measured by CDX HY Gen. 5 Yr Index
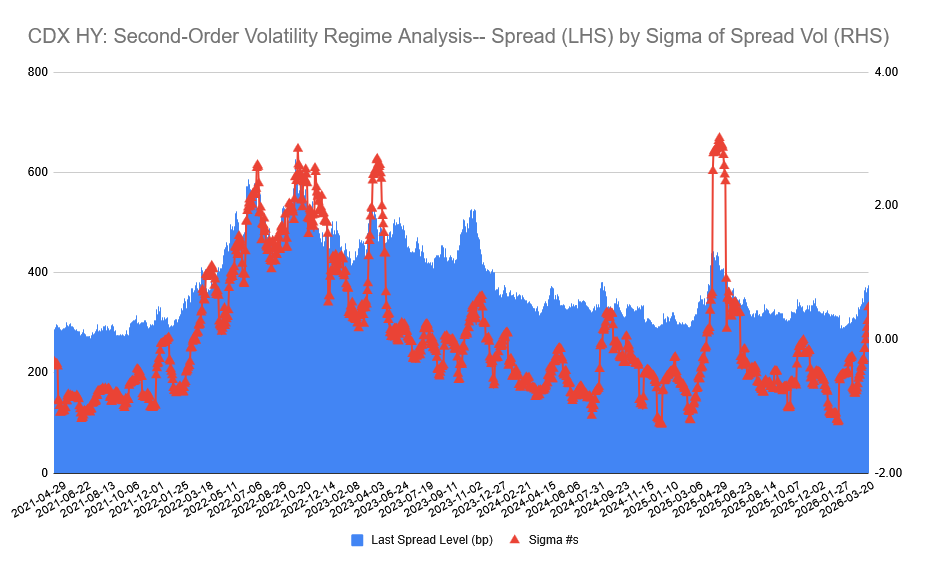
Source: Bloomberg Terminal for Historical CDX HY Gen 5 Yr Index Data, z-score model tested by Google Gemini for as of 3/23/2026.
Bond Market Background- Basis and Bases
After my honorable discharge from the world’s finest Navy, a friend from University of Notre Dame du lac recruited me for interviews at Morgan Stanley’s Global Capital Markets fixed income desk in New York. The desk covered Family officers, Private Wealth Advisors’ Ultra High Net worth clients and institutions such as school endowments and small banks. The year was 2008. I ended up getting my offer the day Bear Stearns received a bail out credit facility via the Maiden Lane project at the Fed vis a vis JP Morgan. The bond market was beginning to price in the tremors with widening in non-agency securities products and some credit linked to monoline insurers. However, the equity and much of the credit markets had yet to recognize the massive uncertainty of the magnitude of underpriced drawdown volatility. Three things stood out to me when I moved up there from DC:
The traders measured risk in terms of Standard Deviation of bp delta volatility for their P&L bans.
The sales people were still able to perform a successful capital market raise for a multi billion Tier one QDI $1000 OTC traded preferred note for JP Morgan (JPM 7.90s non-call 5 year).
Everyone seemed to be a Yankees fan: the desk was composed of many Patriotic, red NY blue, 9/11 survivors so Yanks baseball talk was always a good stress reliever at the coffee machine or gym.
At that time, due to injuries, the Yankees were in their last season at the Stadium of Mickey Mantle and Lou Gehrig– playoff odds were looking about as rosy as a “AAA” rated CDO^2, but the team put on a brave fight the season, finishing 3rd in AL East. One could never fully count out the team with Metallica loving Mariano Rivera on the mound, especially given his 102 mph fast ball– let alone Jeter at short. After the Yanks bowed out at their last game in the old stadium to defeat the Orioles thanks to the Sandman’s closer (Morgan Stanley comped my ND friend and I with tickets, for which I’ll always be grateful), no one could have predicted that in just one season a ~three sigma event would happen to the pinstripes: a pennant run and championship.
Comparatively, in between the tail of two Yankee seasons, it is hard in retrospect to fathom that the market had not yet fully priced in the looming two to six sigma event risk in commodities, equities, rates, and credit markets, respectively. Then it is just as remarkable that by the year of their World Series run, the markets not only reversed their 2008-1Q09 losses, but they did so in an incredible fashion: with incredible gains across risk markets as the Fed engaged in QE to reflate the credit market and hope that would lead to transmission mechanisms to the real economy.
Fast forward to the present, many Yankees fans, including myself, were bummed that tall rising star, Carlos LaGrange got sent back to the minors after a promising preseason down in Florida. The 6’7’’ pitcher clocks a fast ball at 103 mph. Compared to the average speed of 94.5 in the MLB and a Standard Deviation of 2.5 mph (source: xAI Grok), LaGrange pitches at roughly 3.4 sigmas faster than the mean (i.e.: (103-94.5)/2.5). Thus it is surprising to many that he was sent back to AA ball. However, a friend of mine, Coach Jason Quarles, who played big league baseball and is now strength coach at Georgia State NCAA team likened the “demotion” to what DuLac Capital Advisory L.L.C. would describe as a long term upside call option on LaGrange’s prospects with the franchise– it’s to help him get more reps under his belt on the mound, thereby decreasing the “turbulence volatility” risk of his fastball speed:
“LaGrange still needs to get his command together and throw more strikes, plus he’s a long term investment to them. Don’t want to rush him (ie, hisupside gamma risk outweighs theta risk) and break his confidence…make him more efficient and no stress of the bright lights of the big leagues.”
Yankees prospect Carlos LaGrange pitches 3+ sigmas faster than MLB mean.
DuLac Capital Advisory L.L.C. thinks that institutional investors should approach fixed income allocations in a similar fashion right now. Why? Just as LaGrange’s fast ball has a bit too much “wobbly” variance in its vector to home base to take the seat of Rivera this season, govie rate yields and credit spreads are just too average amid very near term prospects of widening. The trajectory for spreads is simply too much uncertainty in the near term— and recent option market data in key FI ETFs underscores that phenomenon.
Institutional investors have been using sophisticated hedging strategies in the options market on a few key liquid FI ETFs to gain that very optionality given the growing uncertainty around the latest Mideast War will have on industrial demand, consumer spending, and the DM rate market. However, if historical demand destruction sets in over the medium term due to too high of commodity prices, that will add to disinflationary tailwinds for fixed income— thus enabling capital allocators to move it out of “A ball”, and back to the “MLB” for portfolio exposure per unit of risk.
What are the one sigma– let alone 3-6 sigma upside and downside event risks that are in the early stages of the market—in the near and then medium term—and how are institutional allocators beginning to position for them? How is the market estimating the skewness of upside vs downside?
An examination of recent market activity points to three key trends in fixed income:
Institutional Investors are hedging DM govie duration risk through bearish option strategies on iShares 20Year ETF (TLT).
Institutional Investors are hedging spread duration risk via option strategies on HY ETFs HYG and JNK.
Judging by CDX IG 5 Year Generic Index, the investment grade market is trading near average spreads– not yet fully pricing in fat left tail risks. Institutional investors are therefore engaging in defensive positioning with 7+ year duration and $0.90/10 share iShares iBoxx USD Investment Grade Corporate Bond ETF (LQD).
This Thought Piece will provide a brief snapshot on all four corners of the market– vitally important given the massive move in commodities and increasingly bearish trend in rates. It’s still early enough to position given agency MBS spreads vs. USTs are still relatively normal, IG/HY Spreads as measured by CDX are in their long term average, and most importantly for institutions– liquidity still exists across asset classes. We learned from 2008, 2010, 2015, March 2020, and February 2022 that liquidity is among the first to drain away once the market fully realizes what only the initial entrants recognized in inning one. Given the apparent temporary pause to President’s Trump’s “cowboy western-like” 48 hour ultimatum to the IRGC to stop its blockade at the Strait of Hormuz ends Monday 23 March 2026, institutional investors see this as an opportune moment to hedge fixed income beta exposure by investing in optionality through liquid ETFs and other index solutions such as CDX contracts.
2. Rates and Oil: Hormuz Butterfly Effect
The chart below is not of a busted software stock that the market has grown concerned about losing its competitive advantage to Generative AI, but rather the iShares 20+ Year Treasury Bond ETF (TLT). It’s recent price action since the spike in oil appears to indicate TLT is on a one way elevator down to retest its May 2025 lows of $8.97:
iShares 20 Year+ US Treasury ETF (TLT)— will it Catch a Bid if Upside Oil Volatility Decreases?
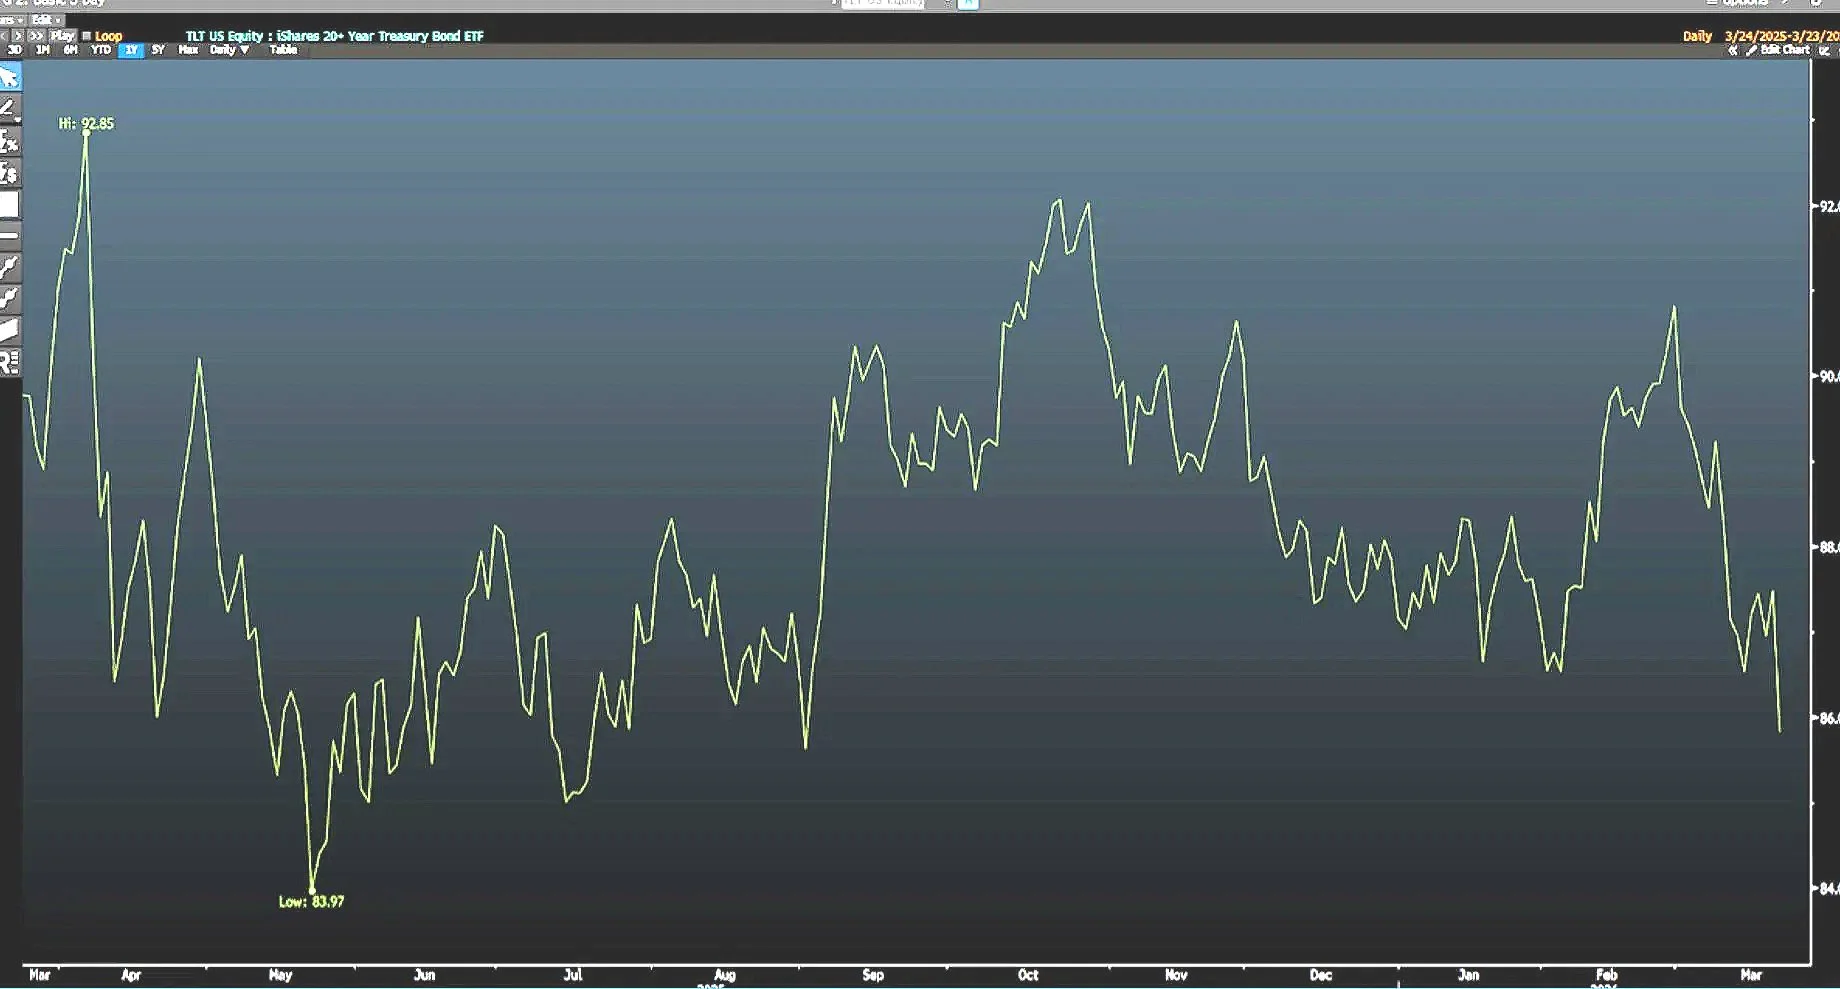
Source: TLT ETF Price Chart from Bloomberg Terminal as of 3/22/2026
What Gives? Oil and Water
From 1st of March 2026 through Friday 20 March 2026, Brent Crude oil surged nearly 48%— these 16 days represented a 4-6.5 sigma event on a daily Standard Deviation of price change basis depending on rolling look-back (source: Bloomberg Terminal, Google Gemini as of 03/22/2026). On Monday 23 March 2026, just before the market opened, President Trump announced on Fox Business that he plans to postpone any strikes on IRGC energy/power infrastructure for five days to allow for bilateral negotiations to play out: S&P500 is up over 1.34% on the news (source: Bloomberg Terminal as of 1400 HR GMT, 3/23/2026). Breaking market headlines from the White House presents a challenging case for any institutional investor who seeks only to monetize absolute direction, rather than relative volatility of spread tightening or widening. This fog of war investing headwind is most evident with an examination of the volatility of Brent Crude Oil front month futures contracts—
Brent’s 14% Drop on 26 March 2026 Monday AM— after its 48% Rise for the first 16 trading Days of March Underscores Institutional Fixed Income Investors’ Need to Gain Optionality via Beta Management Products such as ETFs and CDX
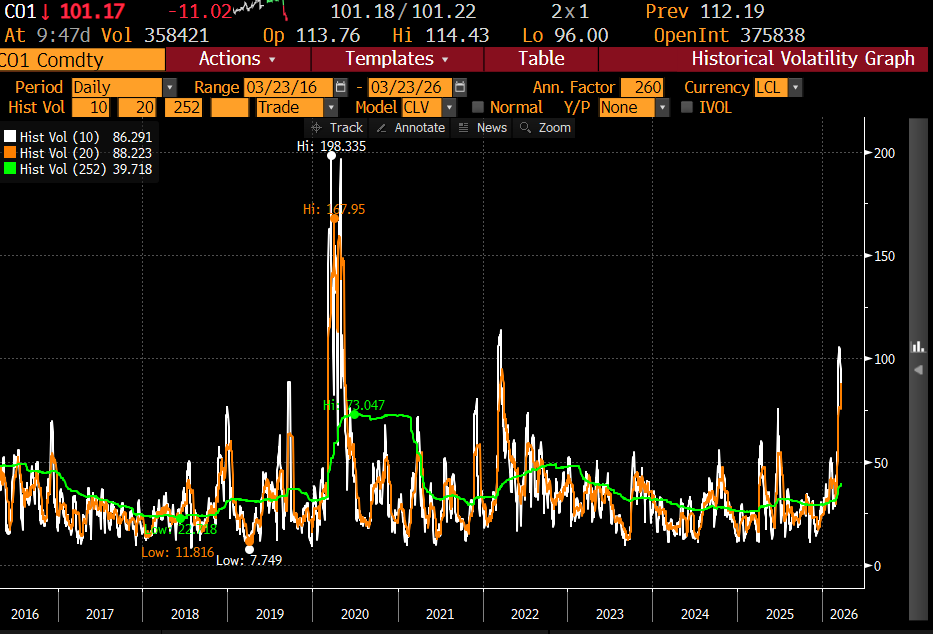
Brent Crude has experienced a 4-6.5 sigma event since the start of the war— but this still pales in comparison to the significant downside volatility experienced at the height of the COVID pandemic, when excess supply and low capacity of storage led to it suddenly trading down to the mid $20s— late 2008 level. Source Bloomberg Terminal HGV Function as of 3/23/2026
Long Bond Optionality for Convexity Hedging—TLT Sensitivity to Oil Shocks
TLT gets even more interesting once you compare it to Brent Crude Oil (front end generic contract)-- especially if compared over a longer period of time. Many multi asset class and fixed income institutional investors are structurally short commodity risk due to investment mandates that leaves them under-exposed to the asset class and associated economic sectors. For instance, IG credit– using the iShares iBoxx Investment Grade Corporate Bond ETF (LQD) as a proxy (it seeks to track the Markit iBoxx USD Liquid Investment Grade Index), Tech and Communications Sectors are over 2x the duration risk contribution as Energy in this ETF. This means institutional investors are currently under levered to the upside commodity risk with their IG exposure– and overexposed to downside rate risk, with their often implicit allocations to USD sovereign rate risk.
Due to the long end steepening, the medium term historical relationship between the long bond tracking ETF, TLT, and Brent Crude signals TLT is fairly attractive vs Brent Crude Oil, with observations within the top decile (-2.2 Standard Deviations from mean). It should be noted that the mean could be shifting due to the Hormuz blockade; this though could indicate bear flatteners in the rate curve are on the way as the front end will have to reprice near term headline inflation that is already being materialized in the long bond (rates, like much of equities, are becoming a “relative game” to the index in the near term due to the commodity shock):
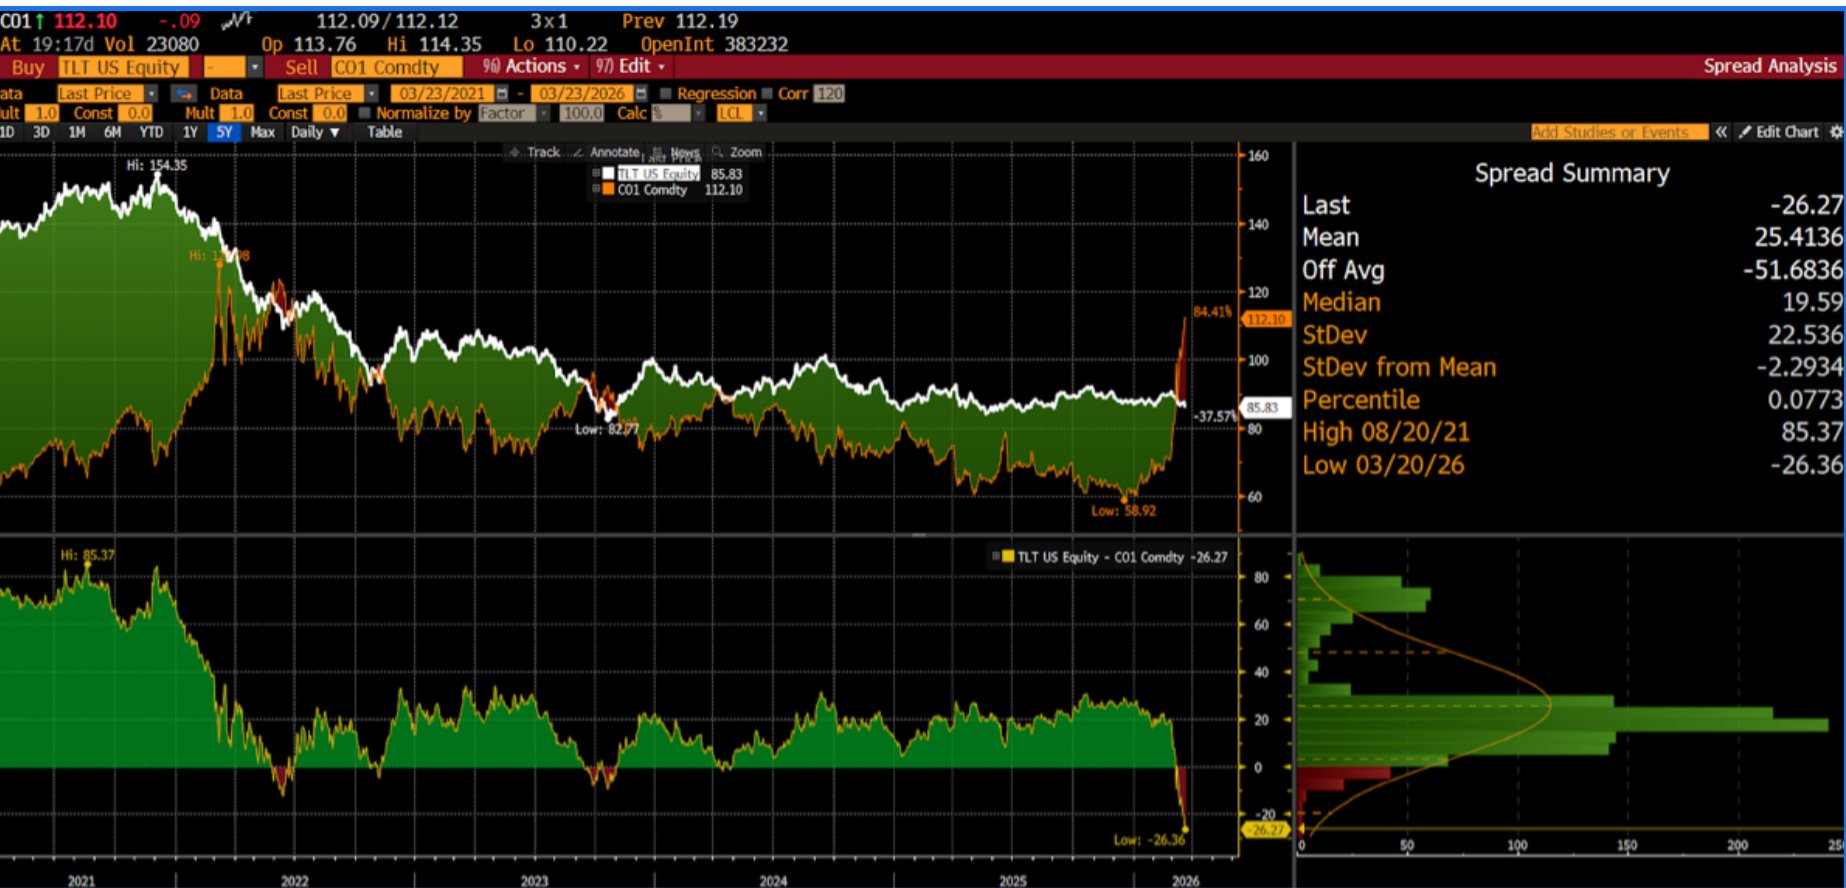
Source: TLT ETF Historical Spread vs Brent Crude Oil Generic Front month Contract from Bloomberg Terminal as of 3/22/2026
How to interpret:
If TLT is greater than Brent (historical Spread basis is Positive): This typically happens during Disinflationary Shocks or "Flight to Quality" events (e.g., 2008 Financial Crisis, 2015 credit/commodities/China contagion (h/t PIMCO), 2020 COVID-19).
In these times, investors seek DV01 of the long bond over animal spirits of commodities.
However if Brent Oil is Greater than TLT (Spread basis is Negative): occurs during pro-cyclical Reflationary/Inflationary Booms (e.g., 2007–early 2008), the early stages of the 2022 Russia-Ukraine shock, and is trending that way now given the current 2026 Middle East tensions).
Here, oil prices spike while bonds are sold off because investors fear rising inflation and term premium will force the Fed to keep rates high.
Nonetheless, using a different charting method— the Historical Regression Analysis function (HRA)— that includes the commodity super cycle of 2006 to early 2008, and the global DM disinflationary period of the 2010 teens, shows TLT to only have a beta of 0.32 with Brent and for there to be only a slight negative correlation.
TLT and Brent Oil: Largely Non-Linear Relationship Between 2006-2016
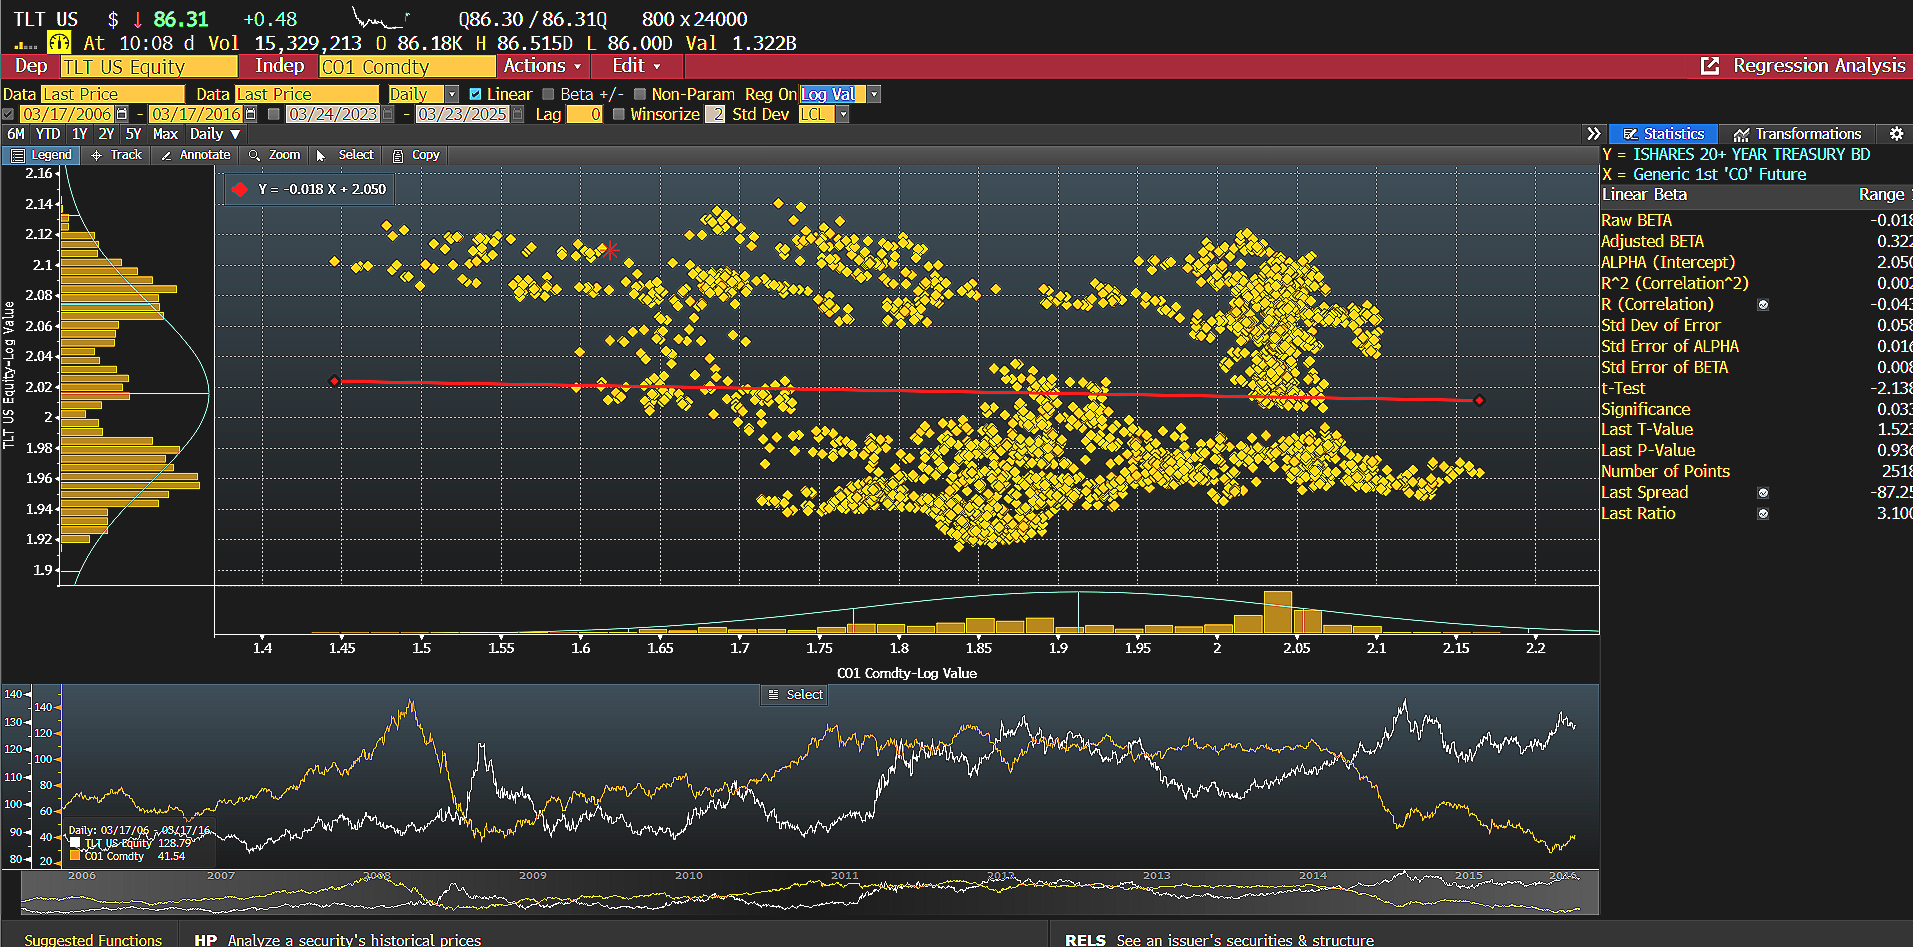
Source: TLT ETF Historical Regression and Spread Analysis vs Brent Crude Oil Generic Front month Contract from Bloomberg Terminal as of 3/23/2026
This points to periods where too high of oil prices leads to demand destruction across economies, thus a disinflation trend that bids the long bond: “The world does not need $120 oil”— Steven Pruiett, CEO of Elevation Resources of Texas (source: Wall Street Journal, 3/16/2026). This history was recently highlighted in an excellent fixed income deep dive analysis by Indiana State Public Retirement Systems analyst, Collin Brown: Disinflationary Signals in the Face of Inflationary Narratives
Savvy fixed income investors know that “the cure for high prices is high prices”-- therefore are likely betting over the longer term, demand destruction to emerge, thereby causing disinflationary headwinds. What is the evidence that there is positioning for this?
Long Haul Optionality– What Institutional Investors are doing with TLT
The previous historical spread and regression charts juxtaposed the near term inflationary headwinds that TLT demonstrates during upside oil shocks with the long-term disinflationary bias experienced during demand destruction commodity drawdowns. This makes it difficult for large asset managers and asset owners to quickly reposition their fixed income allocation “aircraft carrier” for the best direction. This means astute institutional investors are buying optionality at this uncertain market juncture.
An examination of the option chain for TLT courtesy of Nasdaq.com shows institutional investors have been indeed doing that through net credit collars on TLT. For instance, an institutional investor who by mandate must allocate 20-30% to fixed income, therefore has a long bias structurally– may seek to hedge the near term upside commodity shock risk to long bond duration: this is doubly important given the DV01 is between $1.30 to $1.50 per underlying bonds in TLT (i.e., per bond par value of $1,000). The enterprising asset allocators have been selling ~4.4% upside calls with a strike at $90, collecting $0.22 per contract. Meanwhile, the analysis shows the institutional investors are able to reinvest that OTM upside call credit to buy downside 6% protection with $80 puts selling at ~ $0.17 per contract. This strategy amounts to a zero-premium tail-risk insurance for institutional asset owners and managers.
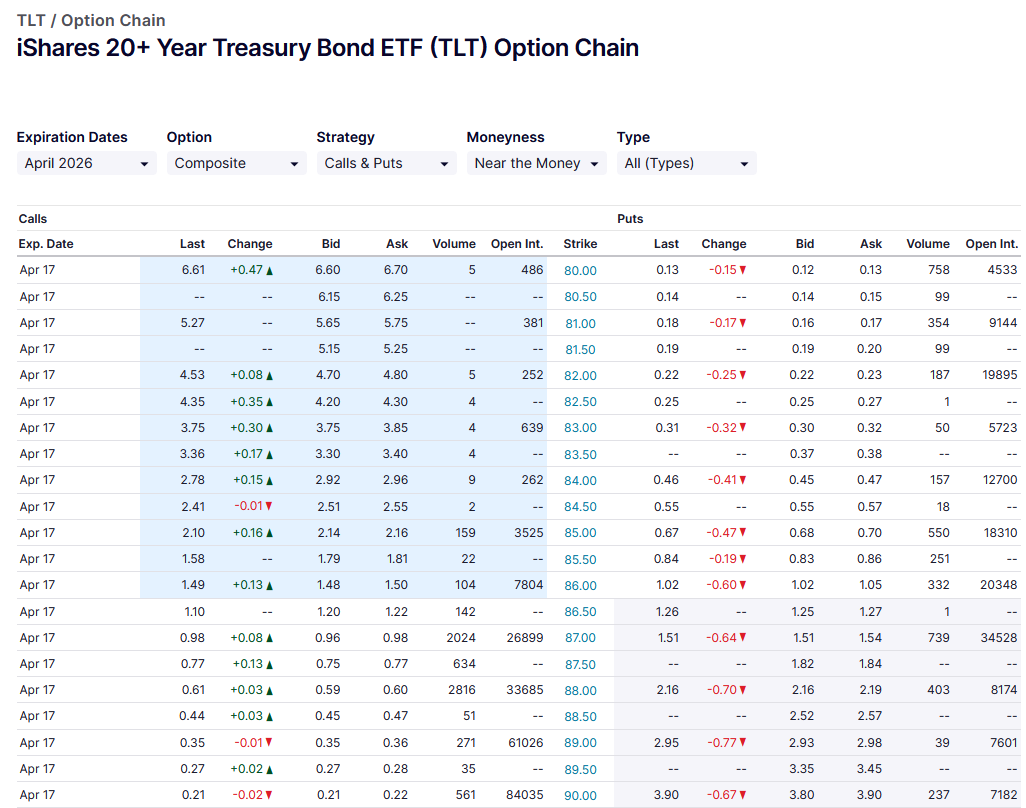
OTM credit collars on TLT are enabling institutional investors to hedge against asymmetric downside skew in the near term (mid April 2026), while still participating in approximately 17bp of upside on their current long bond exposure. Positive carry (+0.05 net) in a world where most hedges cost institutions premium — rare and relatively attractive optionality. Source: Nasdaq.com as of 03/23/2026
This credit collar produces a net credit of $0.05 per contract– enabling structurally long institutional investors to be paid for buying protection, while capping upside with OTM call options that they may view unlikely to be ITM by mid April 2026 given this current upside commodity supply shock is still not yet transmitted through the broader economy. TLT dropping to $81 per share would be approximately a 42bp steepening in Yields (source: Bloomberg Terminal as of 3/23/2026):
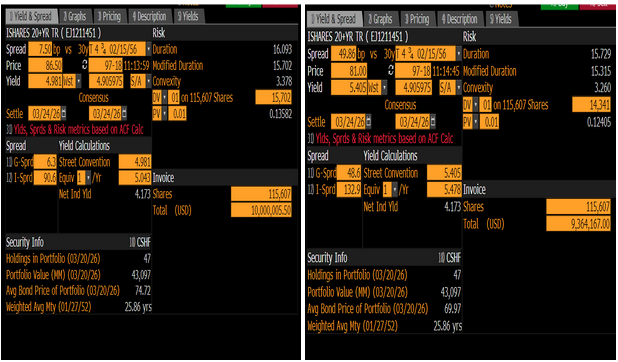
TLT Yield Analysis Screen shows a DV01 $15K per $10,000,005 of notional exposure. A 42bp yield steepening drops the dollar price of TLT to $81 a share— a 6% loss (Source: Bloomberg Terminal as of 3/23/2026). Therefore, smart structurally long index tracking managers likely view this long bond beta management exercise as worthwhile given capping upside risk if yields tighten to 17bp to be the less of two evils for this 17 year duration asset.
3. U.S. High Yield and Oil Beta— Old Tango Partners Reunited Again?
Over the last 5 years, the relationship between the CDX High Yield Generic 5 Year Index, that Bloomberg comprises to track the most recent S&P IHS Markit CDS contracts, and Brent Oil is largely linear with a R² of 0.32 and adjusted beta of 0.83, and last P-Value of 0.11. This may not be intuitively surprising to many given the look-back window includes the oil rebound from the COVID 2020 shock and the Russia full invasion of Ukraine which sent Brent north of $120 per barrel. This may be more surprising however when one considers that energy has ranged only about 7-18% of the index from a spread contribution basis over time (source: Bloomberg, xAI Grok as of 3/24/2026).
2021-2026: Relationship between HY Spreads and Brent Oil is largely Linear on a log adjusted Basis with an Adjusted Beta of 0.83 and R² of 0.32
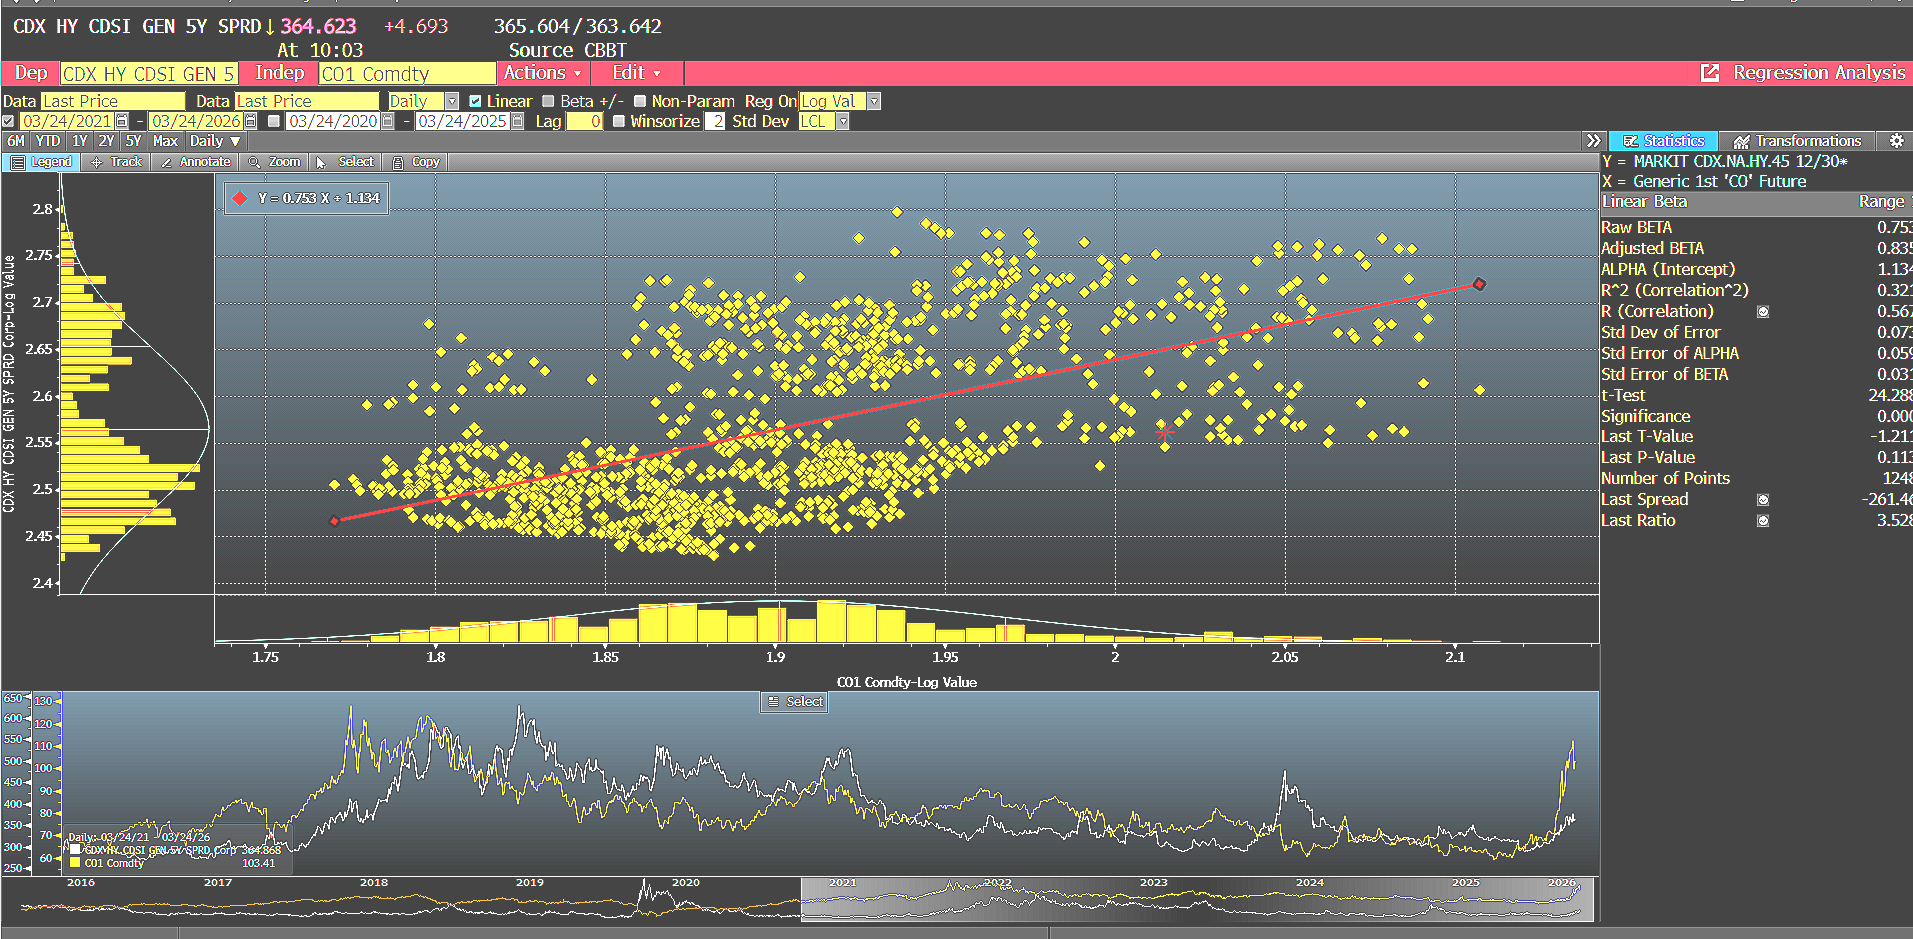
2021-2026 log value relationship between HY CDX Spreads and Oil is fairly statistically significant for credit markets— matching intuition given market participants understand many oil/gas companies are B to BB rated. Source: Bloomberg Terminal as of 3/23/2026.
However, this observation window may be a bit too wide to consider how best to hedge acute optionality that sits ahead in the front window within the fixed income market over the next 6-12 months. An examination of the reverse of what the market sees today— the 2014 to 2016 period where OPEC+ decided to boost supply to curtail USA fracking competition, the relationship is a bit less strong statistically with an R^2 of 0.67— this was likely driven by spread widening from the consumer cyclical and telecom sectors, which largely do not benefit when
Commodity Shock Regime Change Risk Management: Brent Crude Oil was a 0.67% Explanatory Factor to CDX HY Spread Delta on a Log Adjusted Basis during the OPEC+ Supply Glut of 2014-2016
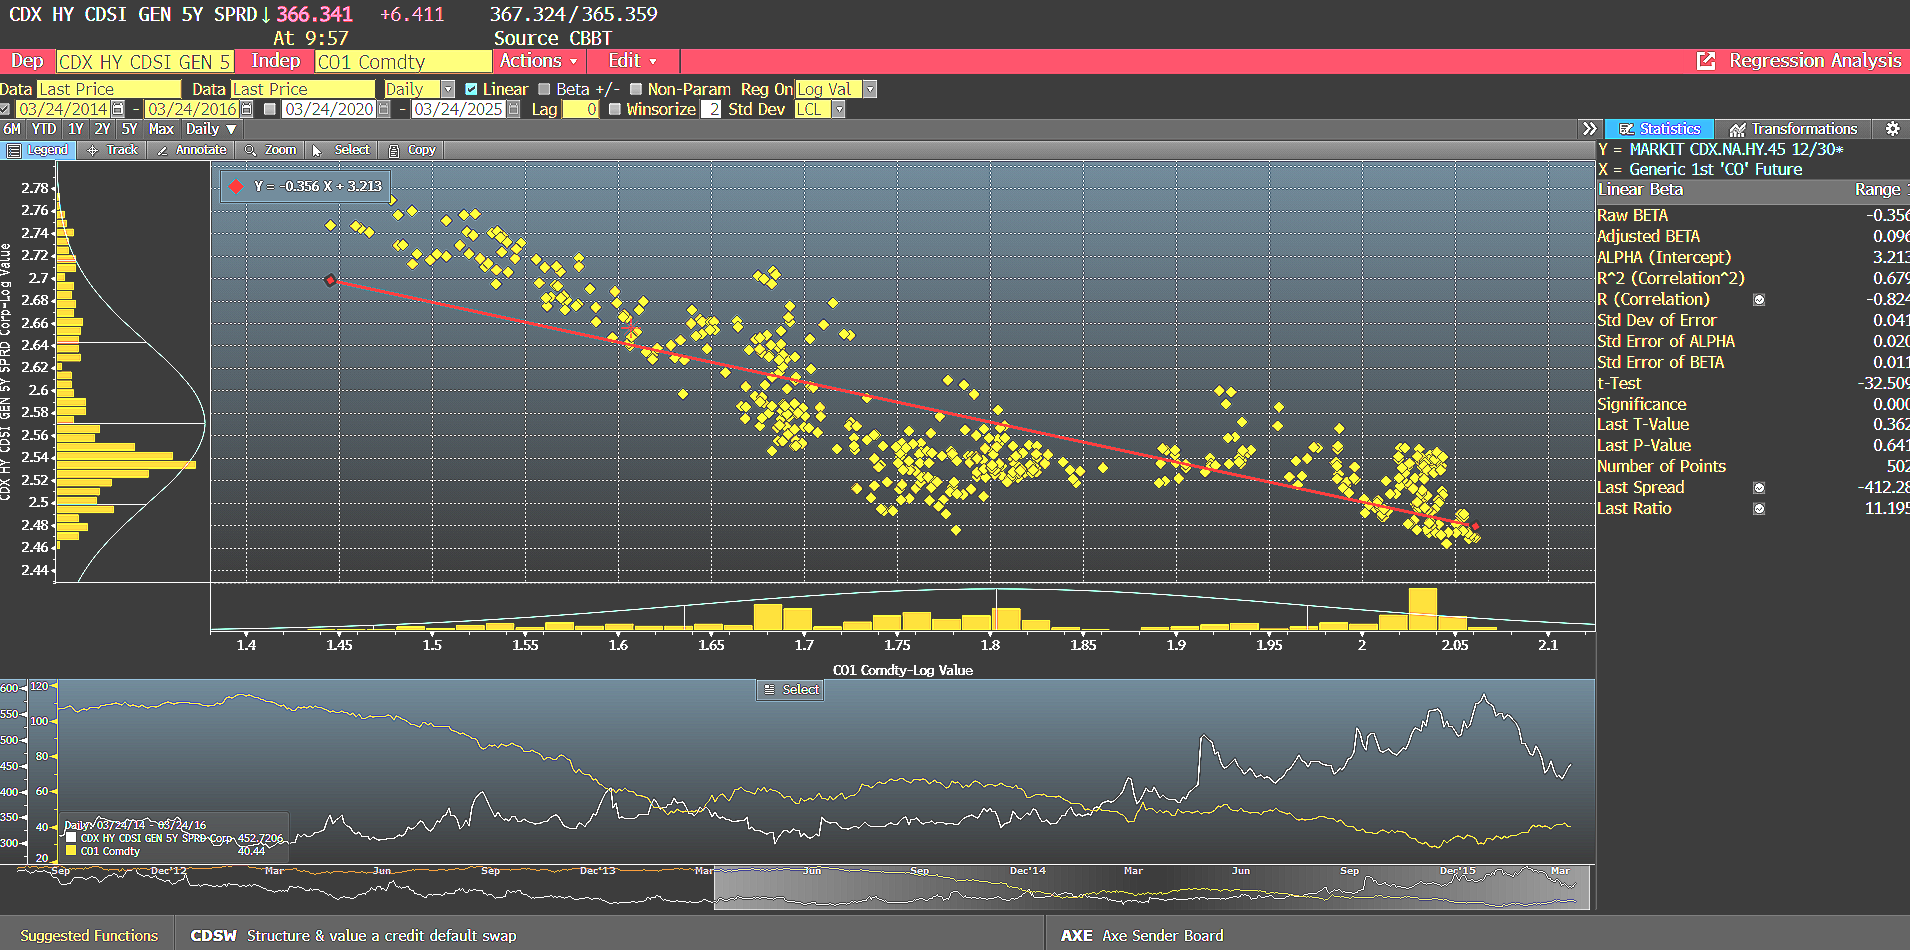
An examination of HY CDX Spreads and previous acute Oil shocks— such as 2014-2016 OPEC+supply glut era, shows a slightly less strong relationship between the two vs the 2021-2026 period. Source: Bloomberg Terminal as of 3/23/2026
Although 40-50% of CDX HY Gen 5 Year Index spread is derived from Consumer Cyclicals and Telecom— which one would think stands to benefit from lower oil prices— this may not always be the case given unusually low oil prices in the USA can be a signal of economic weakness. In 2015, when I was at Morgan Stanley, the Institutional Equity Research team pointed out to the industrial sector recession— which impacted many jobs associated with the fracking era boom. It may be helpful to observe that peak spread on the CDX HY Gen 5 Year Index hit 588bp (Feb 2016)— around the same time Brent dropped to a low of ~$30 per barrel. I recall speaking with a top Prime Brokerage specialist at that time, and he said he seeing significant “trading in HY Energy Bonds” at that time at Goldman Sachs’s security lending desk. Institutional investors were indeed trading individual HY energy to capture asymmetric idiosyncratic, while paring that “core” exposure with satellites of beta through CDX contracts— and ETFs: HYG and JNK.
For instance, BlackRock’s active High Yield Fund, managed by James Keenan, CFA at that time, famously used a put option overlay on his fund’s beta exposure via HYG ETF. Institutional Investors could do similar with the other most liquid HY ETF, JNK from SPDRS State Street. BlackRock Institutional Fixed Income ETF team (disclosure: I worked at BlackRock from 2016-2021) published a research report indicating that HYG had a higher oil fracker beta exposure— thus making it a more optimal hedging vehicle for many institutional investors and fixed income PMs seeking rapid beta management (regardless of delta direction) and cash drag mitigation.
Commodity Shock Regime Change Risk Management: An examination of HYG vs JNK from a Industry Basis Shows Significant Differences in Exposure to Communications and Energy Industries vs. CDX HY index—
With JNK having much more Energy Exposure than the CDX HY and HYG, and Much less Communications Industry exposure, respectively
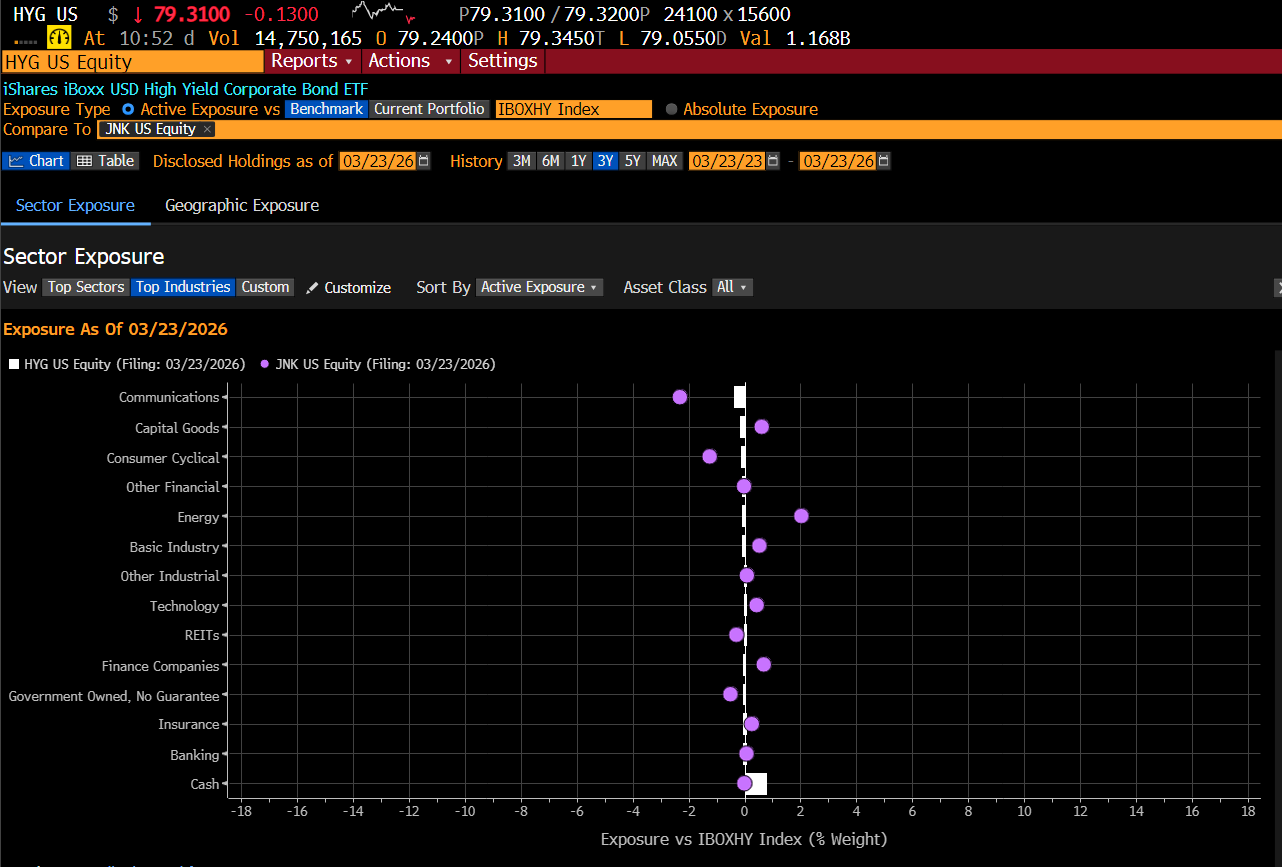
Source for HYG, JNK and CDX HY Generic 5 Yr Index: Bloomberg Terminal as of 3/23/2026
Given the difference in sector breakdown between JNK and HYG, and the current ~4 sigma Oil price change shock, institutional investors may find it helpful to compare the last cycle of a major commodity boom— the 2010 to 2012 period which saw commodities outperform equities.
Commodity Shock Regime Change Risk Management: An examination of that period shows HYG to indeed a Modest R^2 and Beta with Brent Crude Oil than CDX High Yield during the “Arab Spring” Commodity Shock b/w 2010-2012
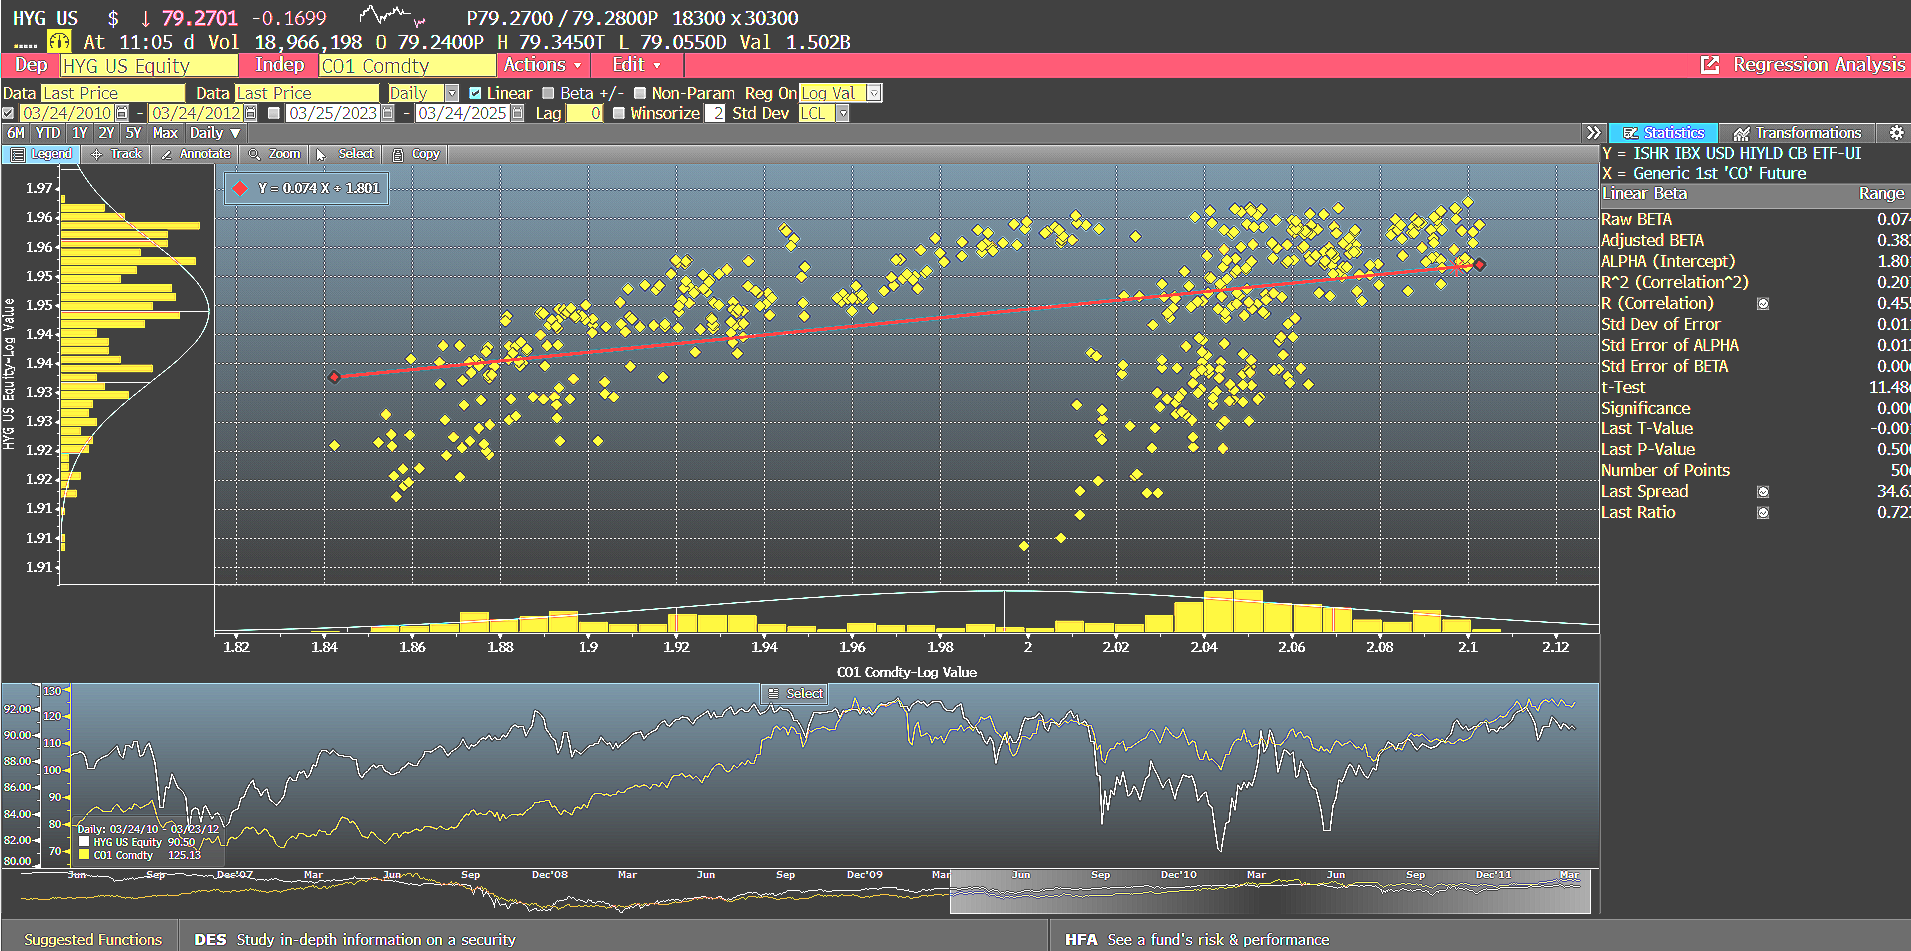
Source for HYG ETF and Brent Crude Historical Regression Analysis: Bloomberg Terminal as of 3/23/2026
JNK Recorded an adjusted Beta of 0.35 and R² with Brent Crude Oil at 0.02— much lower than HYG During the same “Arab Spring” Commodity Shock Period: this indicates insight on index construction matters for proper beta management
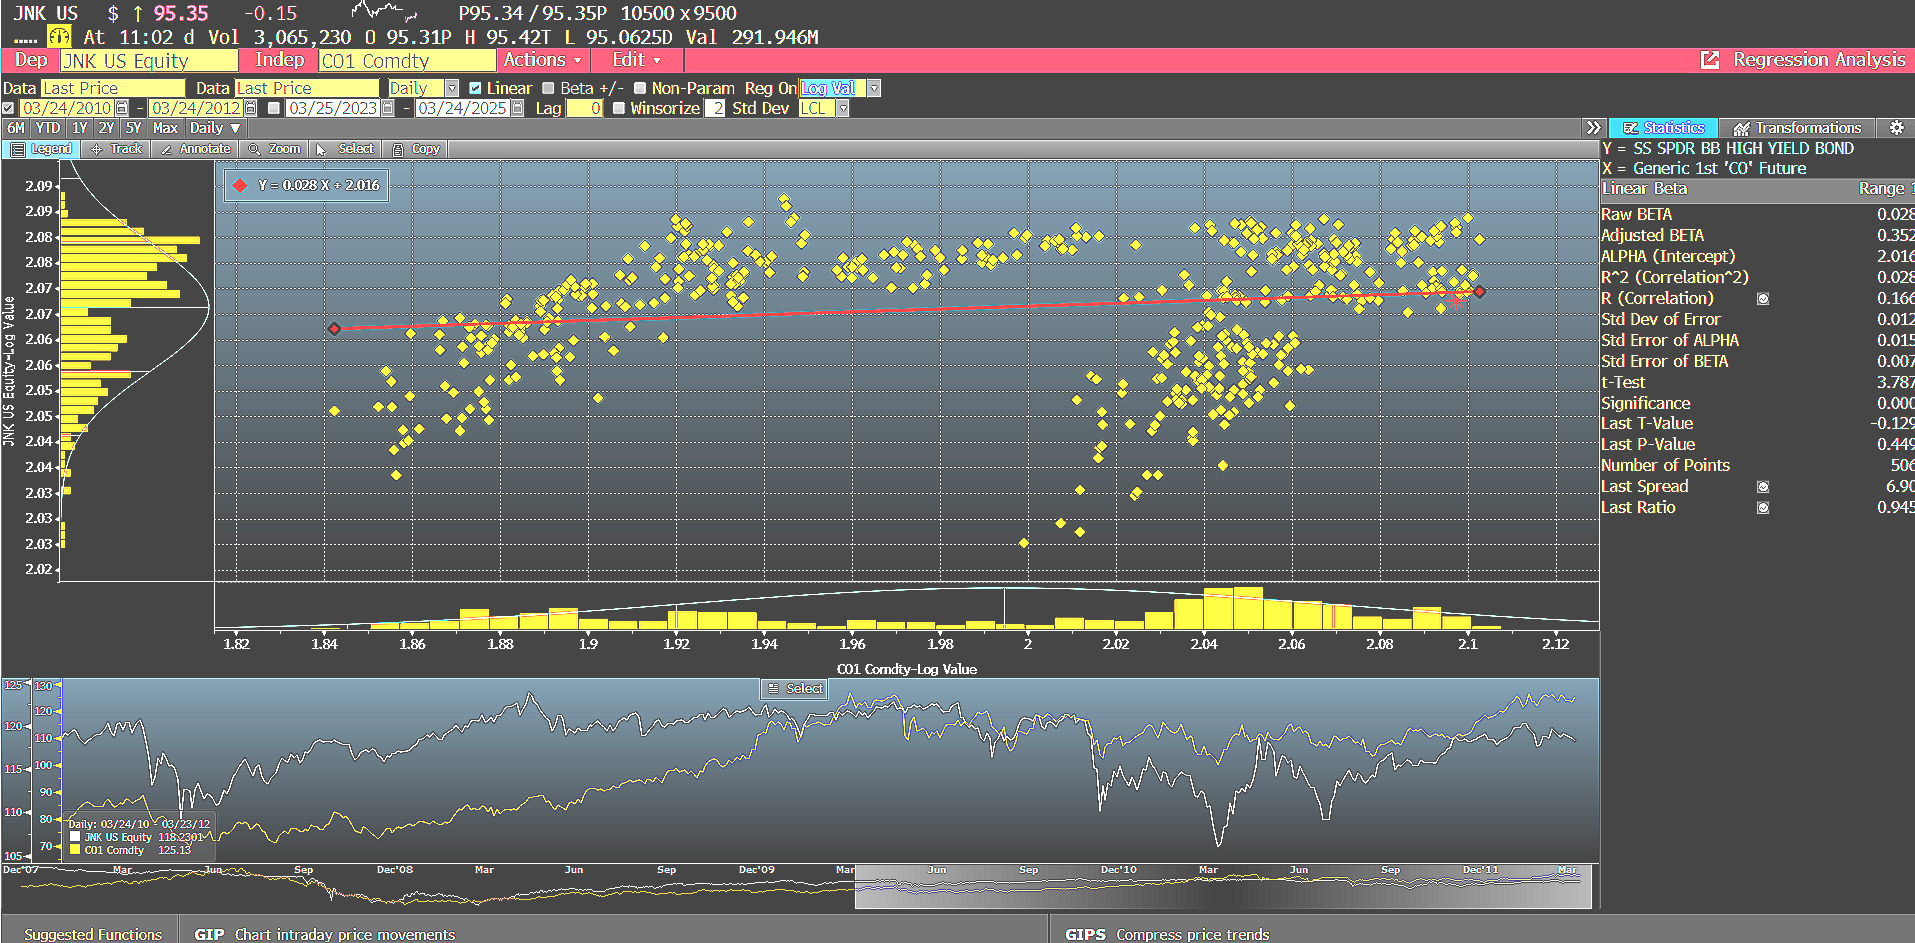
Source for JNK ETF and Brent Crude Historical Regression Analysis: Bloomberg Terminal as of 3/23/2026
Over the Past 5 Years (2021-2026) JNK has Observed a Relatively Statistically Low Relationship with Brent oil from a Log Value Adjusted Regression Comparison basis—
This is in stark contrast to the previous sustained commodity spike of 2010-2012
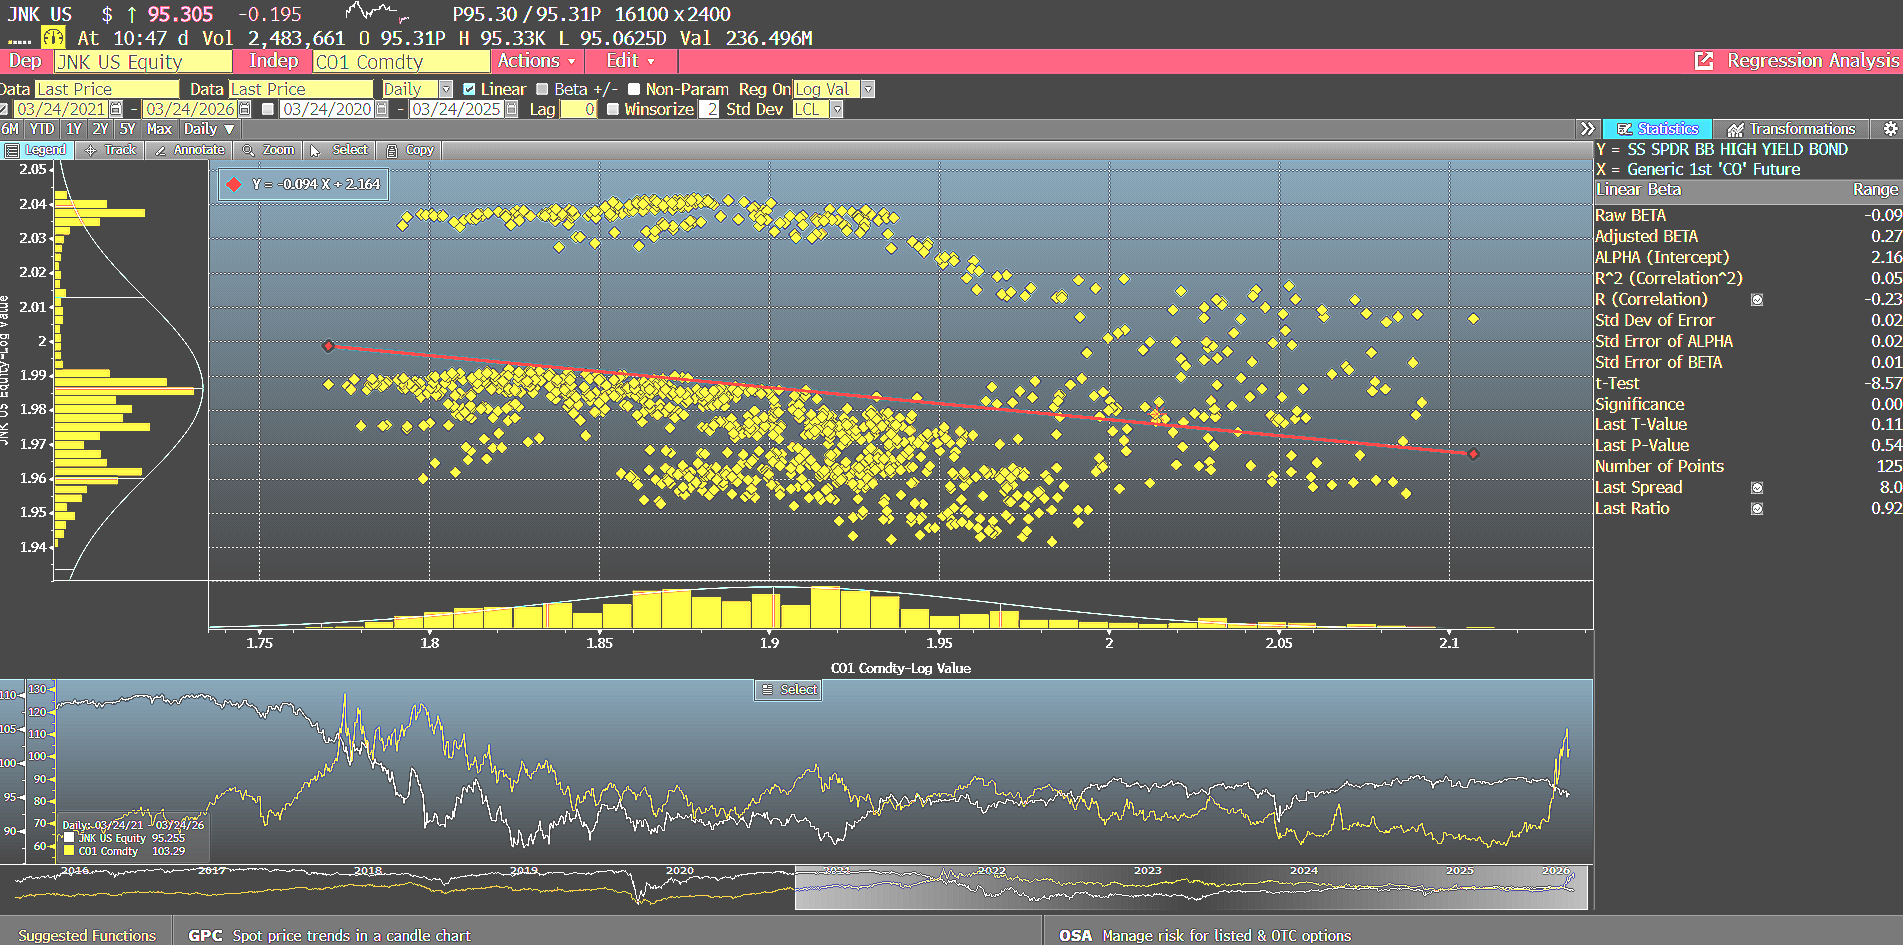
Source for JNK ETF and Brent Crude Historical Regression Analysis: Bloomberg Terminal as of 3/23/2026
Recent Regression (2021-2026) between HYG vs Brent Crude Oil Shows a Weaker Relationship than CDX HY Generic 5 Year Index but a Stronger relationship than JNK ETF
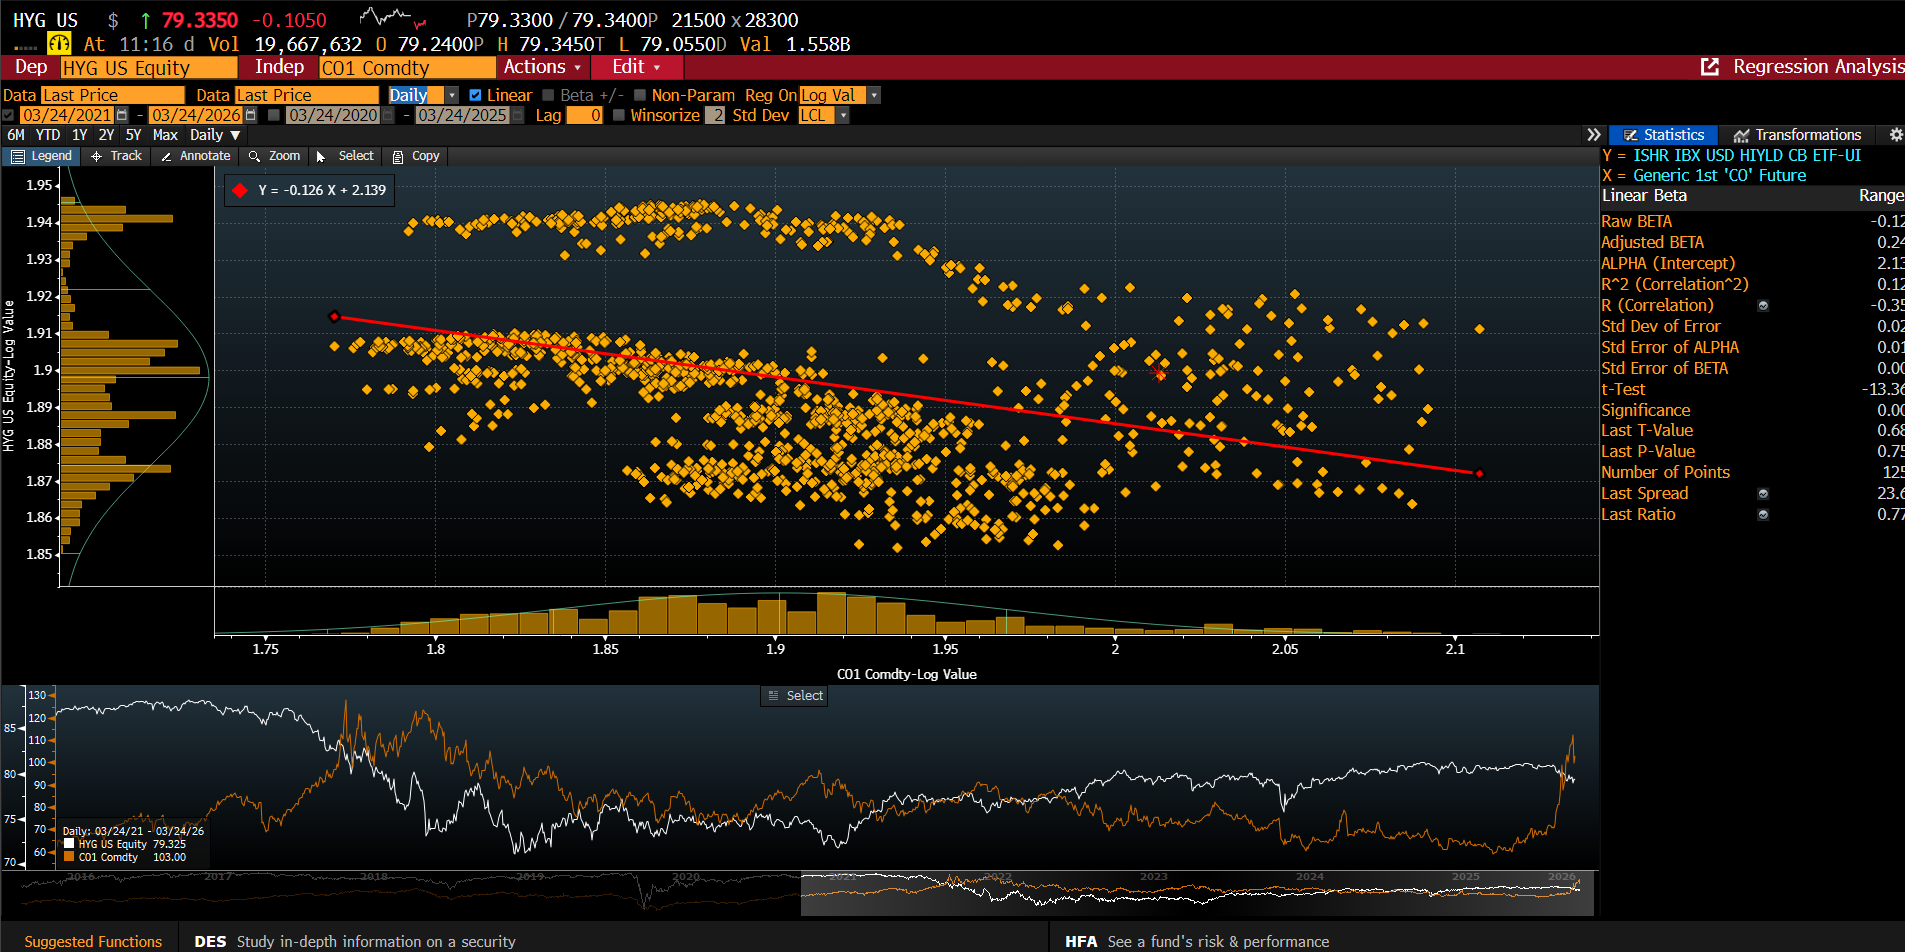
Source for HYG ETF and Brent Crude Historical Regression Analysis: Bloomberg Terminal as of 3/23/2026
4. IG Credit and Rate Risk— Hedging Sensitivity
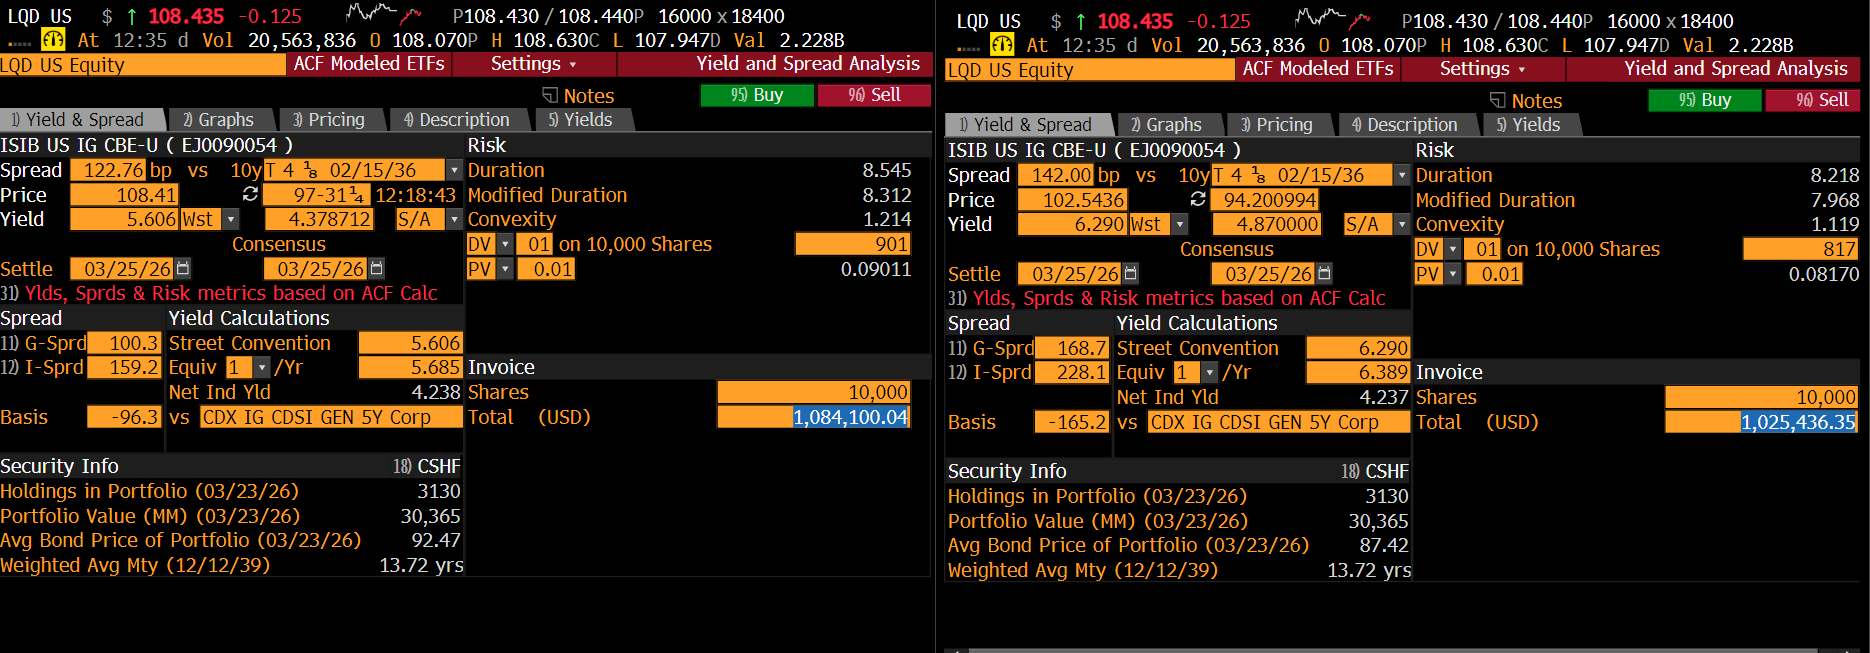
IG credit relative to USTs has grown as a percent of risk budget among many asset allocators since the “beginning of the end” of the Global Financial Crisis in late 2009. Institutional investors have preferred IG credit to rates given the decade long Fed’s QE program dampened nominal yields more more than what actuarial assumption targets required. They viewed the A/AA- rated index exposure— with active manager overlays for alpha generation— was justified given the spread component to abnormally low benchmark rates. LQD ETF has been a beneficiary of this structural allocation tail wind: growing now to hold over $30 Billion in net AUM with hedge funds, pension fund investors, and Global Wealth Management model portfolio allocations all respectively using the IG proxy for exposure.
However, when I was at PIMCO, the PMs used to constantly lament that not doing proper due diligence on one’s index exposure: “just because an issuer issues more bonds, the indices typically add more of that credit as a percent of market cap— not duration risk adjusted— to the index” was repeated when I worked there on the active ETF team. That means it’s now a good time to look under theh hood of IG credit to identify its commodity shock risk and rate shock risk: two important components considering the DV01 for IG credit’s LQD is in the $8,396 range per 100K share allocation.
IG Credit (CDX IG Generic 5 Yr Index) Spreads Typically Widen during Periods of Oil Price Shocks Over Last 5 Years— for every 1% increase in Brent Oil, CDX IG Spreads Widen by 0.86 units of risk (0.00865 basis points)
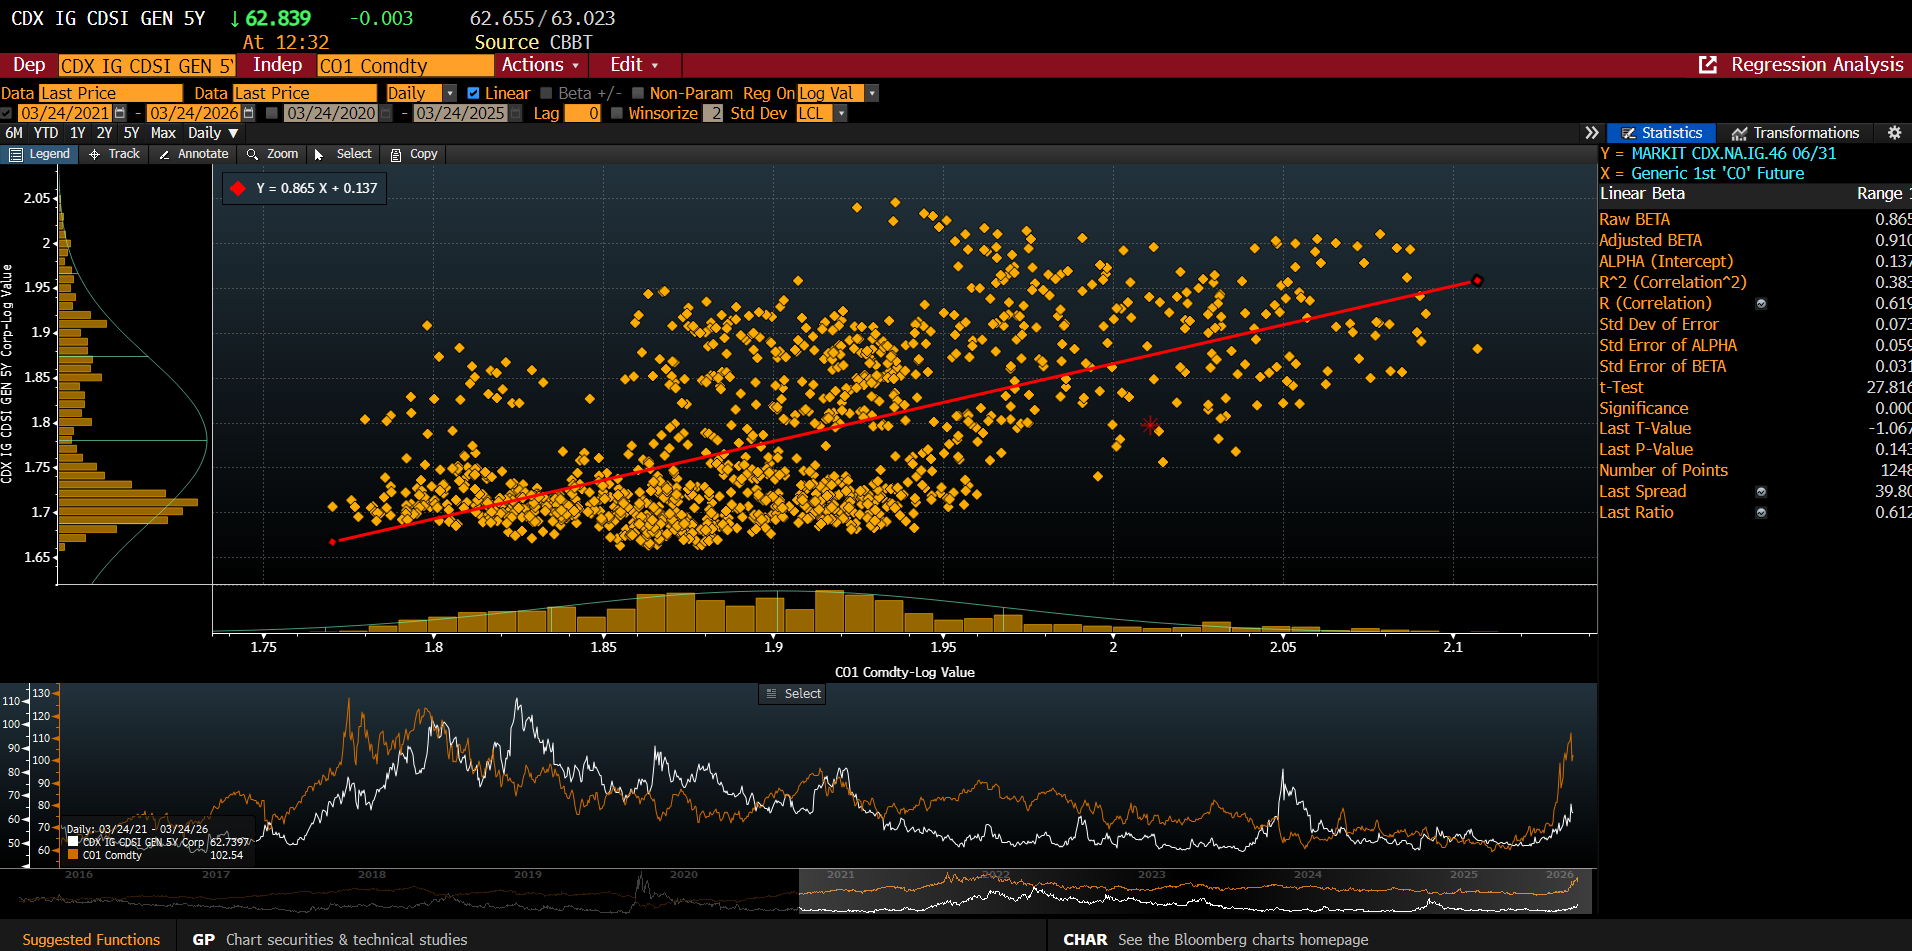
Source for CDX IG Gen 5 Yr Index and Brent Crude Historical Regression Analysis: Bloomberg Terminal as of 3/23/2026
While many American casual investors may estimate that higher oil is “good for energy names” and thus IG credit, the Bloomberg Terminal’s 5 year regression analysis of the CDX IG Gen 5 Year Index indicates a more systemic shock to IG Credit is on the horizon. With a statistically significant 0.865 Beta and a 38% R², IG spreads have historically moved in lockstep with Brent: compare this though to the fact that only recently has the market observed any spread widening. This upward slope represents the market pricing in Non-Linear Inflationary Risk—as oil spikes, the 'Input Cost' for the 125 companies in the index rises— this could signal compressing margins, lower EBITDA/Debt ratios, and thus widening spreads.
Commodity & Rate Shock Regime Shift: A 50bp Steepening in Benchmark US Govie Rates and a 1 Standard Deviation Widening in Credit (~20bp) Could Indicates LQD Could see a ~5% Decline in Price Per Share—
Source for LQD ETF and US 10 yr Bond Yield Analysis: Bloomberg Terminal as of 3/24/2026
As the 2026 Mideast “Crash Out” scenario concerns continue to grow in directional uncertainty, this cumulative commodity shock driven inflationary— and rate term premium— pressure is exactly what could cause a more significant spread widening regime shift in IG credit over High Yield. This is why DuLac Capital Advisory L.L.C. projects institutional investors will prefer OTM HY credit strategies for their carry while hedging oil/rate shock risk by shorting LQD and the IG CDX index in various mechanisms: options, Total Return Index Swaps (TRS), and security lending.
Update: 07/01/2026— CDXHY/JNK Outperforms IG Credit (LQD ETF)
During 2nd Qtr- Less Rate Sensitivity and greater Relative Commodity Beta Enabled HY (CDX HY/JNK/HYG) to Outperform IG (LQD ETF)
The Second quarter of 2026 recorded whipsaw action in risk assets. From six sigma event risk priced in the Oil market, extreme left-tail hedging in the equity market during the first week of April 2026, to then a statistically significant relief rally once President Trump announced a cease-fire deal with the IRGC on 7 April 2026. Equities and credit rallied— and rates stabilized.
What is most interesting is the absolute and relative outperformance of HY compared to IG Credit. Late in 1st quarter, DuLac Capital Advisory, L.L.C. projected that institutional investors would seek to maintain a net long in credit, but hedge out the duration risk. One method we estimated for implementing this investment theme would be by receiving carry on HY via CDX— while shorting hard dollar duration-sensitive IG credit via left-tail options on LQD ETF or outright borrow.
The trade worked out well— CDX HY generated over 1.5% in excess returns versus LQD ETF:
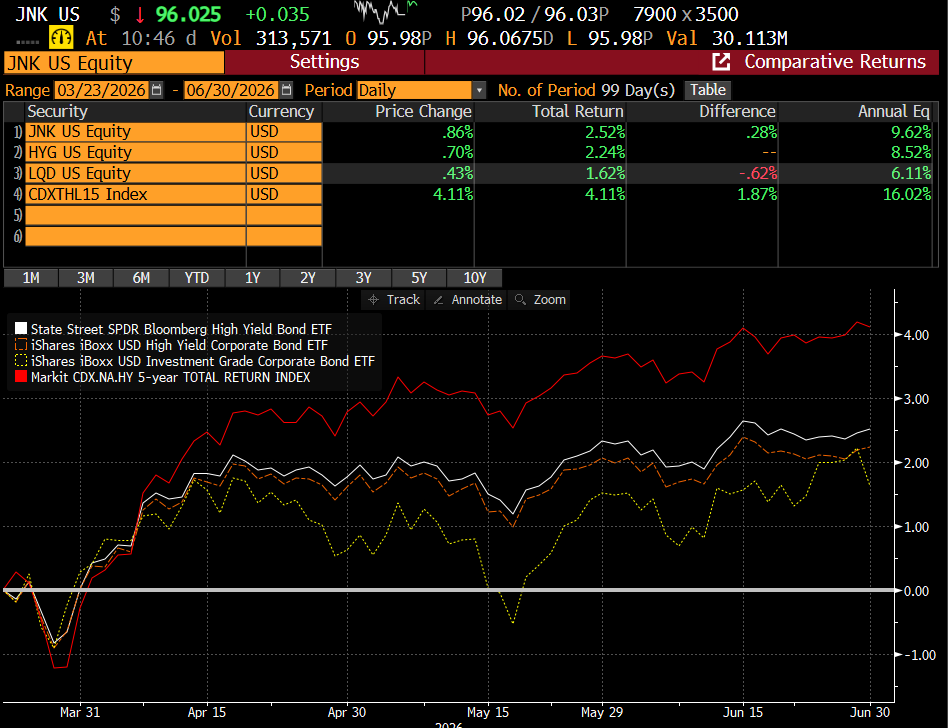
CDX HY Index (CDXTHL15 Index) outperformed IG Credit on an absolute and relative basis. Source: Bloomberg Terminal as of 06/30/2026
Chips off the Table
We expect that credit investors will take some chips off the HY credit table relative to IG due to HY spreads trading near their 5 year tights vs IG (when measuring CDX IG vs CDX HY). Therefore, institutional investors may find selling OTM upside volatility on options based on JNK/HYG ETFs. while taking those proceeds and saving them for a “rainy day” may be the most optimal path to take in this lofty market.
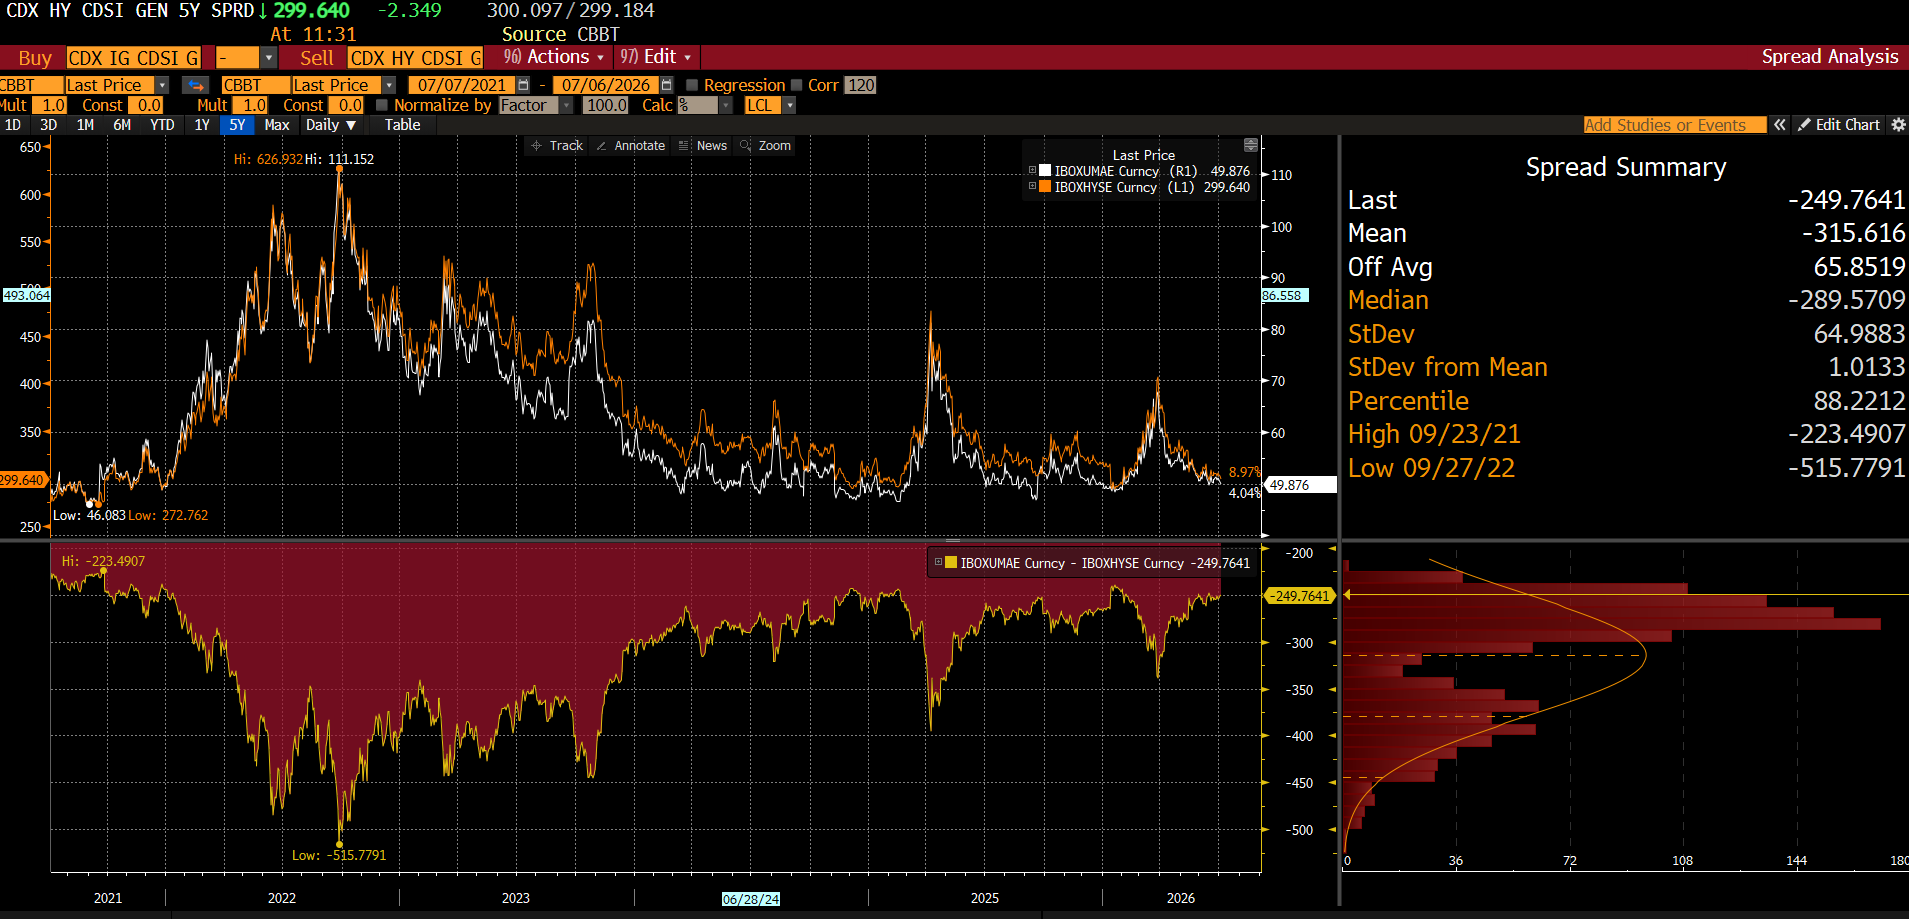
CDXHY is trading near the top decile of tightness on a relative spread basis vs CDXIG. Source: Bloomberg Terminal
Editor’s Note:
Please reach out to ryanscott@dulaccapitaladvisory.com for the rest of this latest Thought Piece on how Institutional Investors are Using FI ETFs to Gain Optionality on Continued Mideast “Crash Out” Concerns that covers IG and HY credit. The full piece includes rich insight on DV01 and PV01 impact for too FI ETFs under a sigma shift in market regime due to historical Oil Shocks, creation /redemption signal deciphering, and what institutional investors are doing with FI ETF Options.
DuLac Capital Advisory—Independent index solutions due diligence for asymmetric event risk.
RyanScott@dulaccapitaladvisory.com | +1‑516‑838‑6833
Investment News, Market Insight, and Investment Insight Disclaimer
Definition of “Crash Out”: Mideast “Crash Out” Concerns/Risks refer to the USA-Iran war materializing into significantly more reckless activity and thus event risk than originally perceived on the opening salvo of the war (28 Feb 2026). From an investment point of view underpriced Mideast “Crash Out” Risk could lead to a high-velocity geopolitical regime shift resulting in asymmetric commodity volatility, equity market re-valuation, and heightened credit spread change volatility.
The information, investment news, and policy insights provided by DuLac Capital Advisory L.L.C. ("the Firm") through its publications, reports, newsletters, and communications, including but not limited to Investment News, Market Insight, and Investment Insight, are intended for informational and educational purposes only. These materials are not to be construed as specific investment recommendations or advice. DuLac Capital Advisory L.L.C. is a technical services management consultant for companies and institutional investors. DuLac Capital Advisory L.L.C. does not receive any revenue from any company or service mentioned in this insight piece.
Not Investment Advice:
The materials provided by the Firm do not constitute investment advice or recommendations to buy, sell, or hold any securities or investment products. The insights offered are general in nature and do not take into account the individual circumstances, investment objectives, risk tolerance, or financial situation of any particular institutional investor or recipient.
No Reliance:
Institutional investors should not rely solely on the information provided by the Firm for making investment decisions. It is recommended that investors conduct their own due diligence, seek advice from qualified financial professionals, and carefully consider their investment objectives and risk appetite before making any investment decisions.
No Guarantee:
While the Firm strives to provide accurate and up-to-date information, there is no guarantee of the accuracy, completeness, or reliability of the information provided. The financial markets and economic conditions are subject to change, and the information provided may become outdated or irrelevant over time.
Risk Disclosure:
Investing in financial markets involves inherent risks, and the value of investments may go up or down. Past performance is not indicative of future results. Institutional investors should be aware of the potential risks associated with investment decisions and should consult with professionals who are qualified to provide personalized investment advice.
No Endorsement:
Any mention of specific securities, investment products, or companies does not constitute an endorsement, recommendation, or promotion of those securities, products, or companies by the Firm. The inclusion of any such information is for informational purposes only. No compensation was received from including any investment product or technology into the White Paper.
Legal and Regulatory Considerations:
Institutional investors are responsible for understanding and complying with all applicable laws, regulations, and guidelines related to their investment activities. The Firm's materials are not intended to replace or substitute for legal or regulatory advice.
The Firm disclaims any liability for the use or interpretation of the information provided in its materials. Institutional investors should use their judgment and exercise caution when relying on any information provided by the Firm.
For personalized investment advice tailored to your individual circumstances, we strongly recommend consulting with licensed financial advisor at a major Wealth Manager.