

ETF Barbell Strategies for Mideast “Crash Out” Concerns: Update Three— Oh, Canada (BBCA, EWC)
Bottom Line Up Front— BBCA, EWC as part of Commodity Shock Barbell Strategy
Uncertainty of Latest Mideast War Escalation Drives Barbell Strategy Rationale: Amid ongoing US-Israel strikes on IRGC infrastructure and naval guerrilla tactics on the Strait of Hormuz disrupting 30% of global seaborne oil supply, institutional investors face heightened tail risks. Delta-neutral barbell ETF strategies via covered collars offers investors that very optionality. iShares MSCI Saudi Arabia ETF (KSA) has recorded minor uptick in oil beta during the first 10 trading days of the war and has recorded the strongest momentum month to date (source: Bloomberg Terminal, Google Finance as of 3/15/2026) relative to its Mideast peers. This momentum points to KSA ETF acting as a potential MSCI EM GCC anchor exposure for asset allocators. This barbell strategy is for those seeking value with a catalyst– despite infrastructure damage concerns.
iShares Saudi Arabia ETF (KSA) recent Outperformance in March 2026 Lends to Strategic Appeal within MSCI EM Allocators:KSA ETF has historically shown a 43% explanatory factor with front-end oil (positive slope). Additionally, KSA ETF outperforming GCC peers and ACWX/SPY YTD— and especially since the start of the war; its high value factor (~40% financials) and Red Sea pipeline to the Yanub port supports overweighting for beta exposure, coupled with an options overlay strategy may enable MSCI EM allocators to derisk from y/y East Asian commodity importers. This should be viewed as an important risk management exercise before the looming commodity supply shock trickles through to their index constituents cost inputs. From an ETF technical signal note, KSA ETF’s redemptions were surprisingly muted during the first 10 days of the war. This is despite a 40% volatility spike since the start of the war vs its ytd through February 2026 average (source: iShares.com, Bloomberg, Base44.
ACWX ETF’s Recent Oil Decoupling Raises Uncertainty of Commodity importing EM and DM countries: per Bloomberg Terminal Historical Regression Analysis (log Value) ACWX's historic five year 43% negative R^2 with oil. driven by East Asian tech rallies, but potential mean reversion could be catalyzed by a forward oil futures curve catching a bid vs spot. This could exacerbate headwinds for commodity shock sensitive non-US equities, underscoring the need for commodity-sensitive hedges (source: Bloomberg Terminal, DuLac Capital Advisory L.L.C.)
Integrating Canadian ETFs for Delta-Neutral Balance: Additionally, structurally long institutional investors may be looking for a "DM pair" to anchor the other end of their more volatile preferred GCC State exposure-- natural resource and energy infrastructure rich Canadian equity beta fits this demand. Pair KSA ETF with JPMorgan Betabuilders Canada ETF (BBCA)or iShares MSCI Canada ETF (EWC) in a delta neutral barbell method. Leverage Canada's EM-like commodity exposure (8% of ACWI ex-US, including mining for AI/nuclear tailwinds) and significant oil infrastructure. Interestingly, the trailing 5 year relationship with front end oil is negative (25% factor). However,
Actionable Insight for Institutions: DuLac Capital Advisory L.L.C. sees institutional investors adopting a KSA-Canada ETF (e.g. EEC, BBCA) barbell strategy to supplement their GCC exposure. This May especially be the case with structural longs like pensions/endowments to manage beta and gain convexity; monitor creation/redemption flows and oil curves for timely adjustments, enhancing portfolio resilience in this fog of war.
A. Intro: KSA and EWC/BBCA ETF Barbell Strategy for Continued Portfolio Optionality as Mideast “Crash Out” Scenario Goes from Concern to Reality
On Monday 3/2/2026 DuLac Capital Advisory L.L.C. published a guide estimating institutional investors would examine the utility of delta neutral barbell strategies– primarily through covered collar strategies– to gain optionality against Mideast “Crash Out” Scenarios. Many in the market during the first few trading days following the Spartan-like launch by USA and Israel vs the IRGC regime and infrastructure were sanguine that the war would be over quickly– and thus faded tail risks.
IRGC's Shift to Naval Guerrilla Warfare in the Strait of Hormuz: However, by week two on the war, it became increasingly clear that despite the US Navy destroying over 40 IRGC naval vessels-- including the first successful torpedo since Admiral Nimitz era– the IRGC was resorting to guerilla warfare strategy at sea: Faulluja 2.0 but this time in the ever important Strait of Hormuz, which according to the Middle East Forum, transports up to 30% of seaborne oil, and 20% of global supply in total. DuLac Capital Advisory published a piece on the underpriced risk of Suez Canal Crisis 2.0 on 8 March 2026: Update– EIS/KSA Barbell Strategy: ETF/Index Maxxing for Beta Management and Optionality during Rising Mideast Energy Supply Chain Disruptions.
Institutional Shift to Commodity-Sensitive Assets with Absorb Forward Oil Curve Convexity: Institutional investors searched for commodity sensitive stocks and credits– especially ones not as directly tied to tailwinds from the IRGC blockade. Given the oil infrastructure attacks by the IRGC against every member of the GCC and Israel over the past 14 days: much of the explanatory factor (R^2) that oil historically played in the realized convexity of major producers such as Kingdom of Saudi Arabia (e.g., iShares MSCI Saudi Arabia ET: KSA) has been muted relative to front-end oil since the outbreak of the war– making option overlay strategies on the ETF more attractive, especially if paired with security lending income.
This is probably as much to do about investor concerns about infrastructure damage as it is about forward month oil contracts still hovering in the upper $70s per barrel. Additionally, MSCI Saudi Arabia IMI has a high value factor exposure due to its significant financial institutions contribution to total market cap: ~40%.
B. The Explanatory Factor of KSA ETF and Front-End Oil has historically been ~43%-- upward sloping relationship vs the opposite with iShares MSCI MSCI ACWI-exUSA ETF (ACWX):
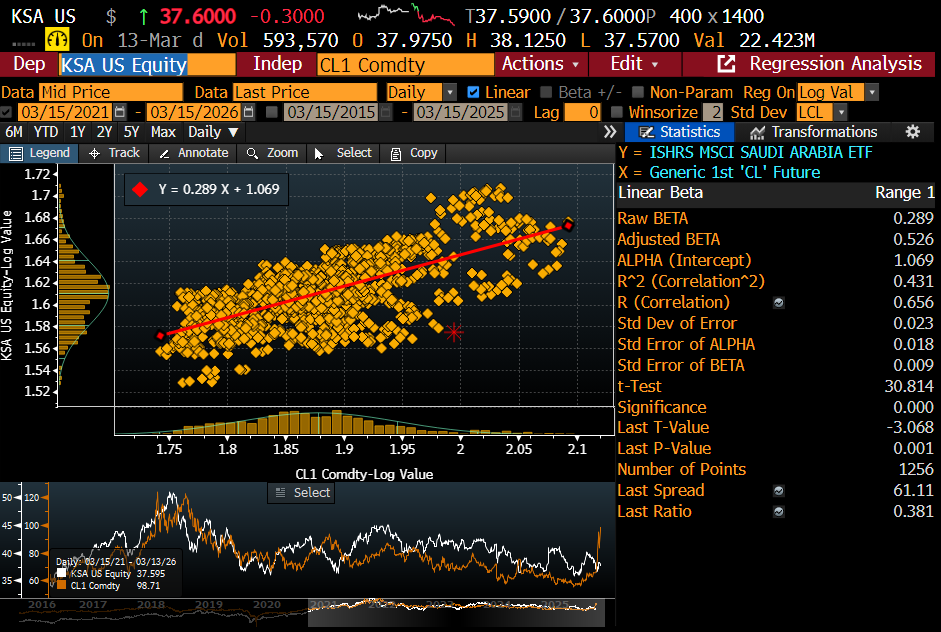
Source for KSA ET regression with front-end Oil: Bloomberg Terminal as of 3/15/2026
KSA ETF's Robust Regression to Front-Month Oil and Relative Outperformance
The Significance of 0.000 indicates a 0% change the the log value relationship between iShares MSCI Saudi Arabia ETF (KSA) and Front-end Oil (CL1) is merely a “fluke” or luck.
Interestingly, KSA ETF has outperformed its GCC peers on a delta basis and especially a delta neutral basis as institutional investors realize its economic infrastructure may be a bit more insulated thanks to its pipeline emptying out to Yanub Port on the Red Sea.
KSA ETF is up ~ 3.96% YTD (source: iShares as of 3/13/2026), outperforming both ACWX ETF and SPY ETF.
This bodes well for those who are structurally long, and seek to gain optionality with their GCC exposure by overweighting KSA relative to other gulf states during this fog of war– through both beta exposure and options overlays.
MSCI Kingdom of Saudi Arabian Equities (KSA ETF) Underperformed ACWX in 2025, but Month to Date (March) have Recorded Resiliency in Spite of IRGC Attempted Attacks on its Energy Infrastructure:

Source: Google Gemini Finance, Stockanalysis.com as of 03/12/2026 at 5PM GMT
Deciphering Creation/Redemption Signals for iShares Saudi Arabia ETF KSA During Volatility and Volume Spikes– Muted Redemptions Despite 40% Vol Rise
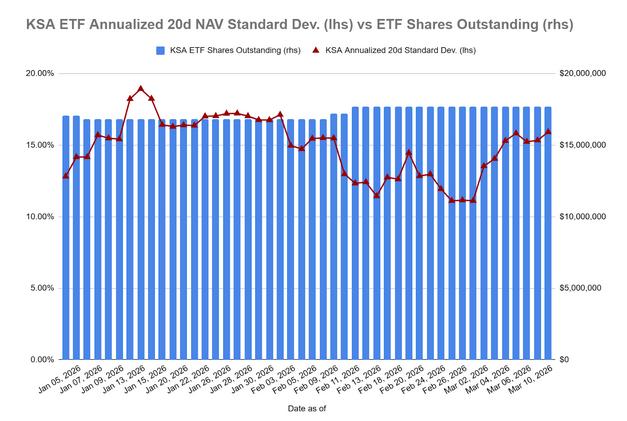
Source: iShares.com, Google Finance Gemini as of 3/10/2026
KSA ETF has Outperformed iShares MSCI ACWI-exUSA ETF (ACWX) Amid the Mideast “Crash Out” Vol Spike— after Underperforming in 2025:
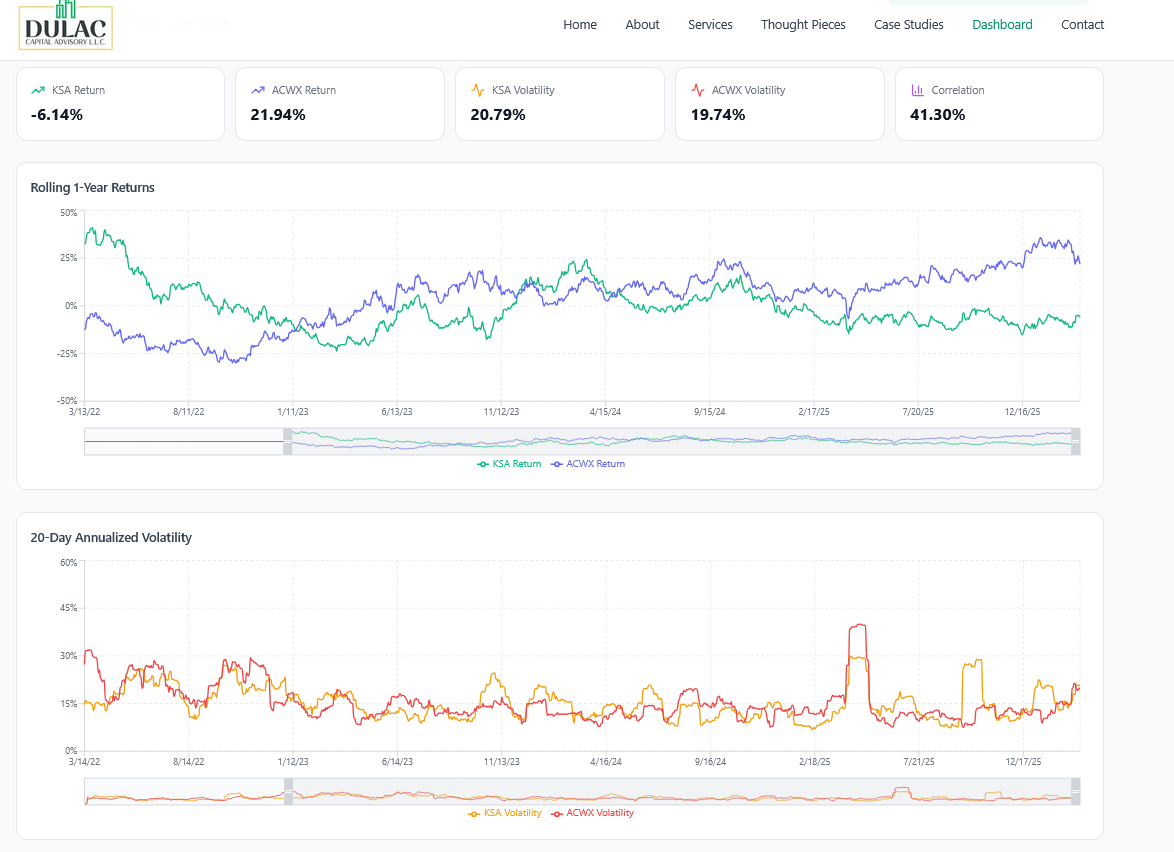
iShares MSCI KSA ETF (KSA) and iShares MSCI ACWIx-USA ETF (ACWX) Annualized Price Returns and 20D Realized Volatility as of 3/15/2026. Source: Google Finance Gemini, Base44.app
Conversely, the Explanatory Factor of ACWX ETF and Front-End Oil has historically been ~43%-- but DOWNWARD sloping relationship:
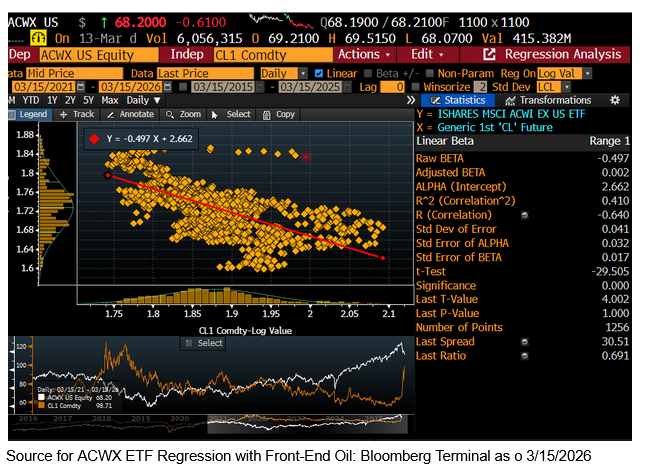
ACWX ETF historically has a downward sloping relationship with front end oil. This is much ado with its heavy European and East Asian exposure. Source: Bloomberg Terminal as of 3/15/2026
ACWX ETF's Recent Decoupling from Historical Oil Sensitivity has Underpriced Mean Reversion Risks if Oil Curve Continues Steep Backwardation:
The Significance of 0.000 indicates a 0% change the the log value relationship between iShares MSCI ACWI-exUSA ETF (ACWX)-- which tracks a $37 Trillion index– and Front-end Oil (CL1) is merely a “fluke” or luck.
While oil usually drives global markets -ex USA, the latest p-value value (using a log value based regression: 1.0) in ACWX ETF vs ront-end oil suggest indicates the market has shrugged off its historical negative sensitivity to higher oil prices– perhaps betting on its East Asian AI-hyperscaler driven tech rallies in Asia (TSMC/Samsung) on days of “commodity relief rallies”.
This could rapidly mean revert if forward oil futures begin to catch up to spot.
C. Canadian Goose (BBCA ETFF, EWC ETF) Meets the Saudi Falcon (KSA ETF)
Structurally long institutional investors such as pension funds and endowments may thus be looking for additional Barbell strategies to cushion against the two prong ACWI-exUSA headwinds of a potential backwardation in the WTI and Brent oil curve– and financials linked to oil financing. This brings MSCI Canada to mind for three key reasons:
MSCI, FTSE, and Morningstar all list Canadian equities in DM– however, its sector exposure reads more like a commodity producing EM country.
MSCI EAFA (primary DM benchmark or many institutional investors’ non-US DM exposure) actually does not include MSCI Canada. Thus, many institutional investors have historically inadvertently been structurally underweight– value factor tilted Canada is about 8% of MSCI ACWI-exUSA, thus too big to ignored.
Many US Institutional investors are New York Rangers or New Jersey Devils fans thus may have an inadvertent bias against the neighbors to they north. Joking.
That said– Canada’s recent sensitivity to front-end oil price movements, measured by log value, has been negatively slopping over the past five years. Using JPM ETF’s $10B net AUM, 19bp expense ratio, and 330K share 90d average aggregate trading volume ETF:
JPMorgan Betabuilders Canada ET (BBCA) as a proxy, the relationship between this index tracking Canadian ETF and front end oil has a 25% explanatory factor– but with a negative raw beta:
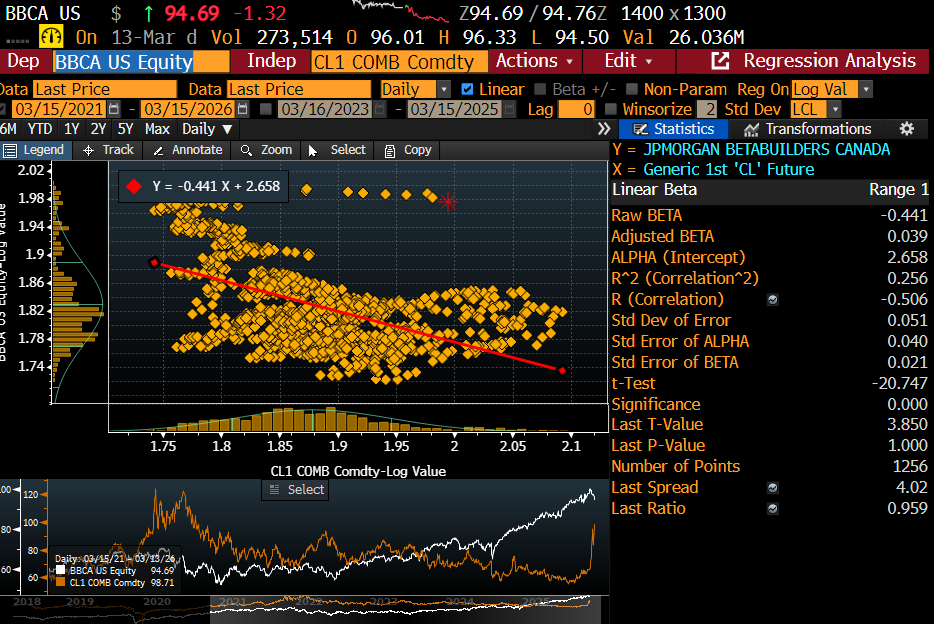
BBCA ETF vs Front Month Oil HRA Function on Bloomberg Terminal as of 3/15/2026
Canadian equities (BBCA, EWC ETFs) derive over 36% of Revenue from Value factor tilted Financials, 16% from Metals & mining, and 15% from Energy
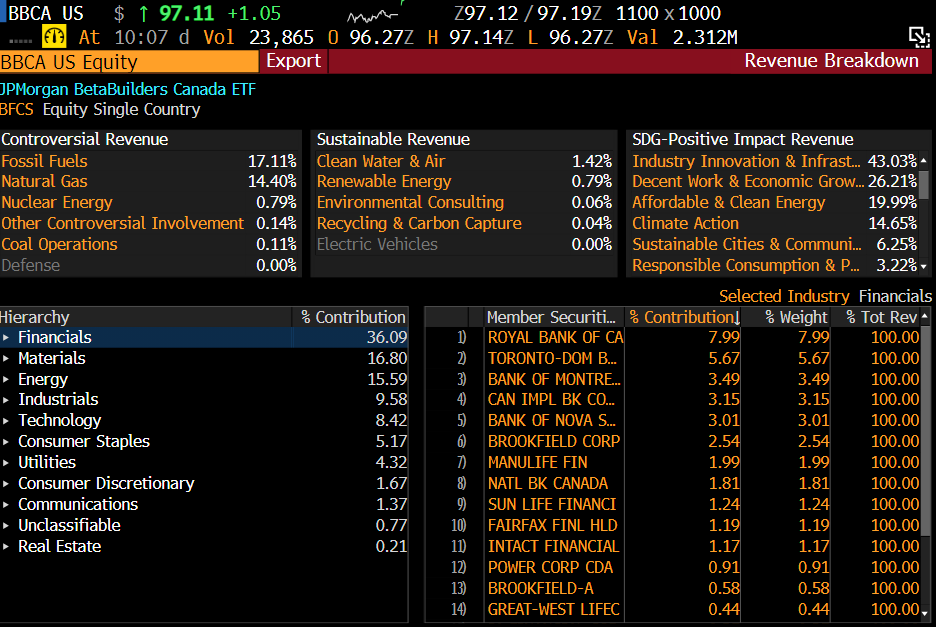
Plus, outside o Oil, Canadian equities as measured by JPM Betabuilder Canada ETF (BBCA) receive over 14% of revenue from Nat Gas— a key growth fossil fuel in Europe and North America. Source: Bloomberg Terminal as o 3/17/2026
Historical Precedent: The 2005–2008 Commodity Super-Cycle and Canadian Equity Resilience:
However, looking back at the last major multi year commodity supply shock– between 2005 to 2008, when “peak oil,” concerns of oil infrastructure damage due to the Iraq war turmoil, and a growing People’s Republic of China (iShares MSCI China all Shares ETF; MCHI) was of utmost concern, Canadian equities had a positively sloping relationship with front end oil.
As measured by iShares MSCI Canada ETF (EWC) since it was around during that time, the relationship with oil explains over 58% of its log value during that period:
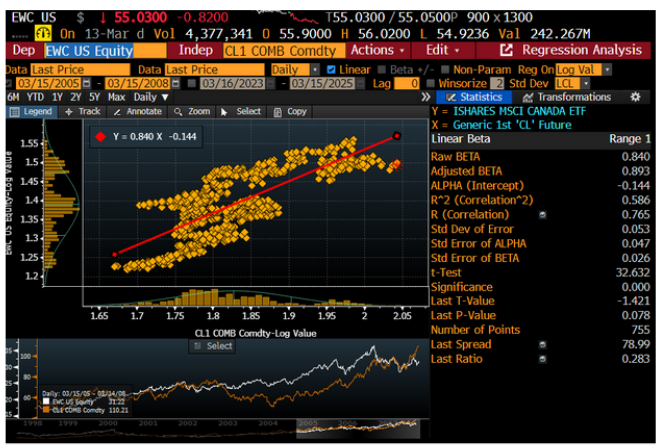
iShares MSCI Canada ETF (EWC) historically observed a strong relationship with front-end oil during the last commodity super-cycle of 2005-2008. Source: Bloomberg Terminal as of 3/17/2026
Historical Echoes: Assessing EWC’s Potential Return to a Commodity-Linked Beta Regime
The Significance of 0.000 indicates a 0% change the the log value relationship between iShares MSCI Canada ETF (EWC)-- which is about 8% of MSCI ACWI-exUSA, had a positive relationship with front end oil during the last major period sustained oil, and entire commodity value chain, supply shock.
The Canadian Metals & Mining Significance: Keep in mind, that Canada is over 16% mining as well (Source: Bloomberg Terminal as o 3/15/2026); with the talk of AI data center scaling, and nuclear plant build outs in Europe, East Asia, and the USA, its mining industry stands to benefit.
D. Summary— Three Takeaways for to Gain Optionality on the "Historical Rhyme" of Commodity Supply Shocks and Canadian Stocks
Although the relationship is negative over the last three years– many institutional investors may decide that history may indeed not repeat, but sure could rhyme to the 2005-2008 period just before the Global Financial Crisis.
BBCA/EWC Underpriced Commodity Shock Upside Risk: While Canadian equities (EWC/BBCA) have shown a negative correlation with oil over the last three years, historical data from the 2005–2008 supply shock period reveals a strong 58% explanatory factor (R²) and a positively sloping relationship with front-end oil. As Mideast tensions shift from "concern" to "reality," Canada offers a proven historical hedge against a potential move into sustained oil backwardation and supply chain disruptions.
Strategic "Delta-Neutral" Barbell Pairing: For institutional allocators, pairing the iShares MSCI Saudi Arabia ETF (KSA) with iShares MSCI Canada ETF (EWC) or JPMorgan BetaBuilders Canada ETF (BBCA) creates a robust delta-neutral barbell. KSA provides a value-tilted anchor (~40% financials) with unique infrastructure insulation via its Red Sea pipeline, while Canada offers EM-like commodity convexity within a Developed Market framework, helping to balance the "commodity-relief" volatility seen in East Asian and European indices (ACWX).
Underpriced Upside in the Rare Earth, Nuclear Energy raw material inputs, and Mining-AI Nexus: Beyond oil, the Canadian thesis is bolstered by its significant exposure to the global mining value chain (~8% of the index per Bloomberg). With the accelerating demand for AI data center scaling (copper/fiber) and the resurgence of nuclear power build-outs (uranium), Canada’s mining industry stands to benefit from a broader commodity super-cycle. This provides an additional layer of diversification for investors seeking to capture tailwinds in the "hard asset" economy.
DuLac Capital Advisory L.L.C. specializes in tech-enabled investment due diligence and portfolio efficiency consulting for institutions. If there's interest in deeper validation, scenario modeling, or bespoke product due diligence on related ETF/index strategies (e.g., stress-testing barbell allocations under prolonged energy disruptions), we’ll be happy to facilitate an introductory discussion with their team to explore potential collaboration.
DuLac Capital Advisory’s ETF/Beta Solutions Risk Due Diligence App : https://www.dulaccapitaladvisory.com/services
(sample version for institutional investors only)
Contact
DuLac Capital Advisory—Independent index solutions due diligence for asymmetric event risk.
ryanScott@dulaccapitaladvisory.com | +1‑516‑838‑6833
Investment News, Market Insight, and Investment Insight Disclaimer
The information, investment news, and policy insights provided by DuLac Capital Advisory L.L.C. ("the Firm") through its publications, reports, newsletters, and communications, including but not limited to Investment News, Market Insight, and Investment Insight, are intended for informational and educational purposes only. These materials are not to be construed as specific investment recommendations or advice. DuLac Capital Advisory L.L.C. is a technical services management consultant for companies and institutional investors. DuLac Capital Advisory L.L.C. does not receive any revenue from any company or service mentioned in this insight piece.
Not Investment Advice:
The materials provided by the Firm do not constitute investment advice or recommendations to buy, sell, or hold any securities or investment products. The insights offered are general in nature and do not take into account the individual circumstances, investment objectives, risk tolerance, or financial situation of any particular institutional investor or recipient.
No Reliance:
Institutional investors should not rely solely on the information provided by the Firm for making investment decisions. It is recommended that investors conduct their own due diligence, seek advice from qualified financial professionals, and carefully consider their investment objectives and risk appetite before making any investment decisions.
No Guarantee:
While the Firm strives to provide accurate and up-to-date information, there is no guarantee of the accuracy, completeness, or reliability of the information provided. The financial markets and economic conditions are subject to change, and the information provided may become outdated or irrelevant over time.
Risk Disclosure:
Investing in financial markets involves inherent risks, and the value of investments may go up or down. Past performance is not indicative of future results. Institutional investors should be aware of the potential risks associated with investment decisions and should consult with professionals who are qualified to provide personalized investment advice.
No Endorsement:
Any mention of specific securities, investment products, or companies does not constitute an endorsement, recommendation, or promotion of those securities, products, or companies by the Firm. The inclusion of any such information is for informational purposes only. No compensation was received from including any investment product or technology into the White Paper.
Legal and Regulatory Considerations:
Institutional investors are responsible for understanding and complying with all applicable laws, regulations, and guidelines related to their investment activities. The Firm's materials are not intended to replace or substitute for legal or regulatory advice.
The Firm disclaims any liability for the use or interpretation of the information provided in its materials. Institutional investors should use their judgment and exercise caution when relying on any information provided by the Firm.
For personalized investment advice tailored to your individual circumstances, we strongly recommend consulting with licensed financial advisor at a major Wealth Manager.